Introduction
It was created to improve upon some shortcomings in [0.6.4]ggsignif::geom_signif()
and [0.6.0]ggpubr::stat_compare_means():
- Inability to adapt stably to faceting.
- Inability to perform layer-level P-value adjustment (ggpubr can achieve panel-level adjustment).
- Failure to perform statistical tests smoothly in the absence of some groupings. This is often the cause of poor faceting performance.
Usually you do not need to specify the test method, you only need to
tell stat_compare whether you want to perform a parametric
test or a nonparametric test, and stat_compare will
automatically choose the appropriate test method based on your data. For
comparisons between two groups, the p-value is calculated by t-test
(parametric) or Wilcoxon rank sum test (nonparametric). For comparisons
among more than two groups, the p-value is calculated by One-way ANOVA
(parametric) or Kruskal-Wallis test (nonparametric).
Basic
p <- ggplot(mpg, aes(class, displ, color = class)) +
  geom_boxplot(show.legend = FALSE) +
theme_test()- Global comparison: Each x has only one group.
p + stat_compare()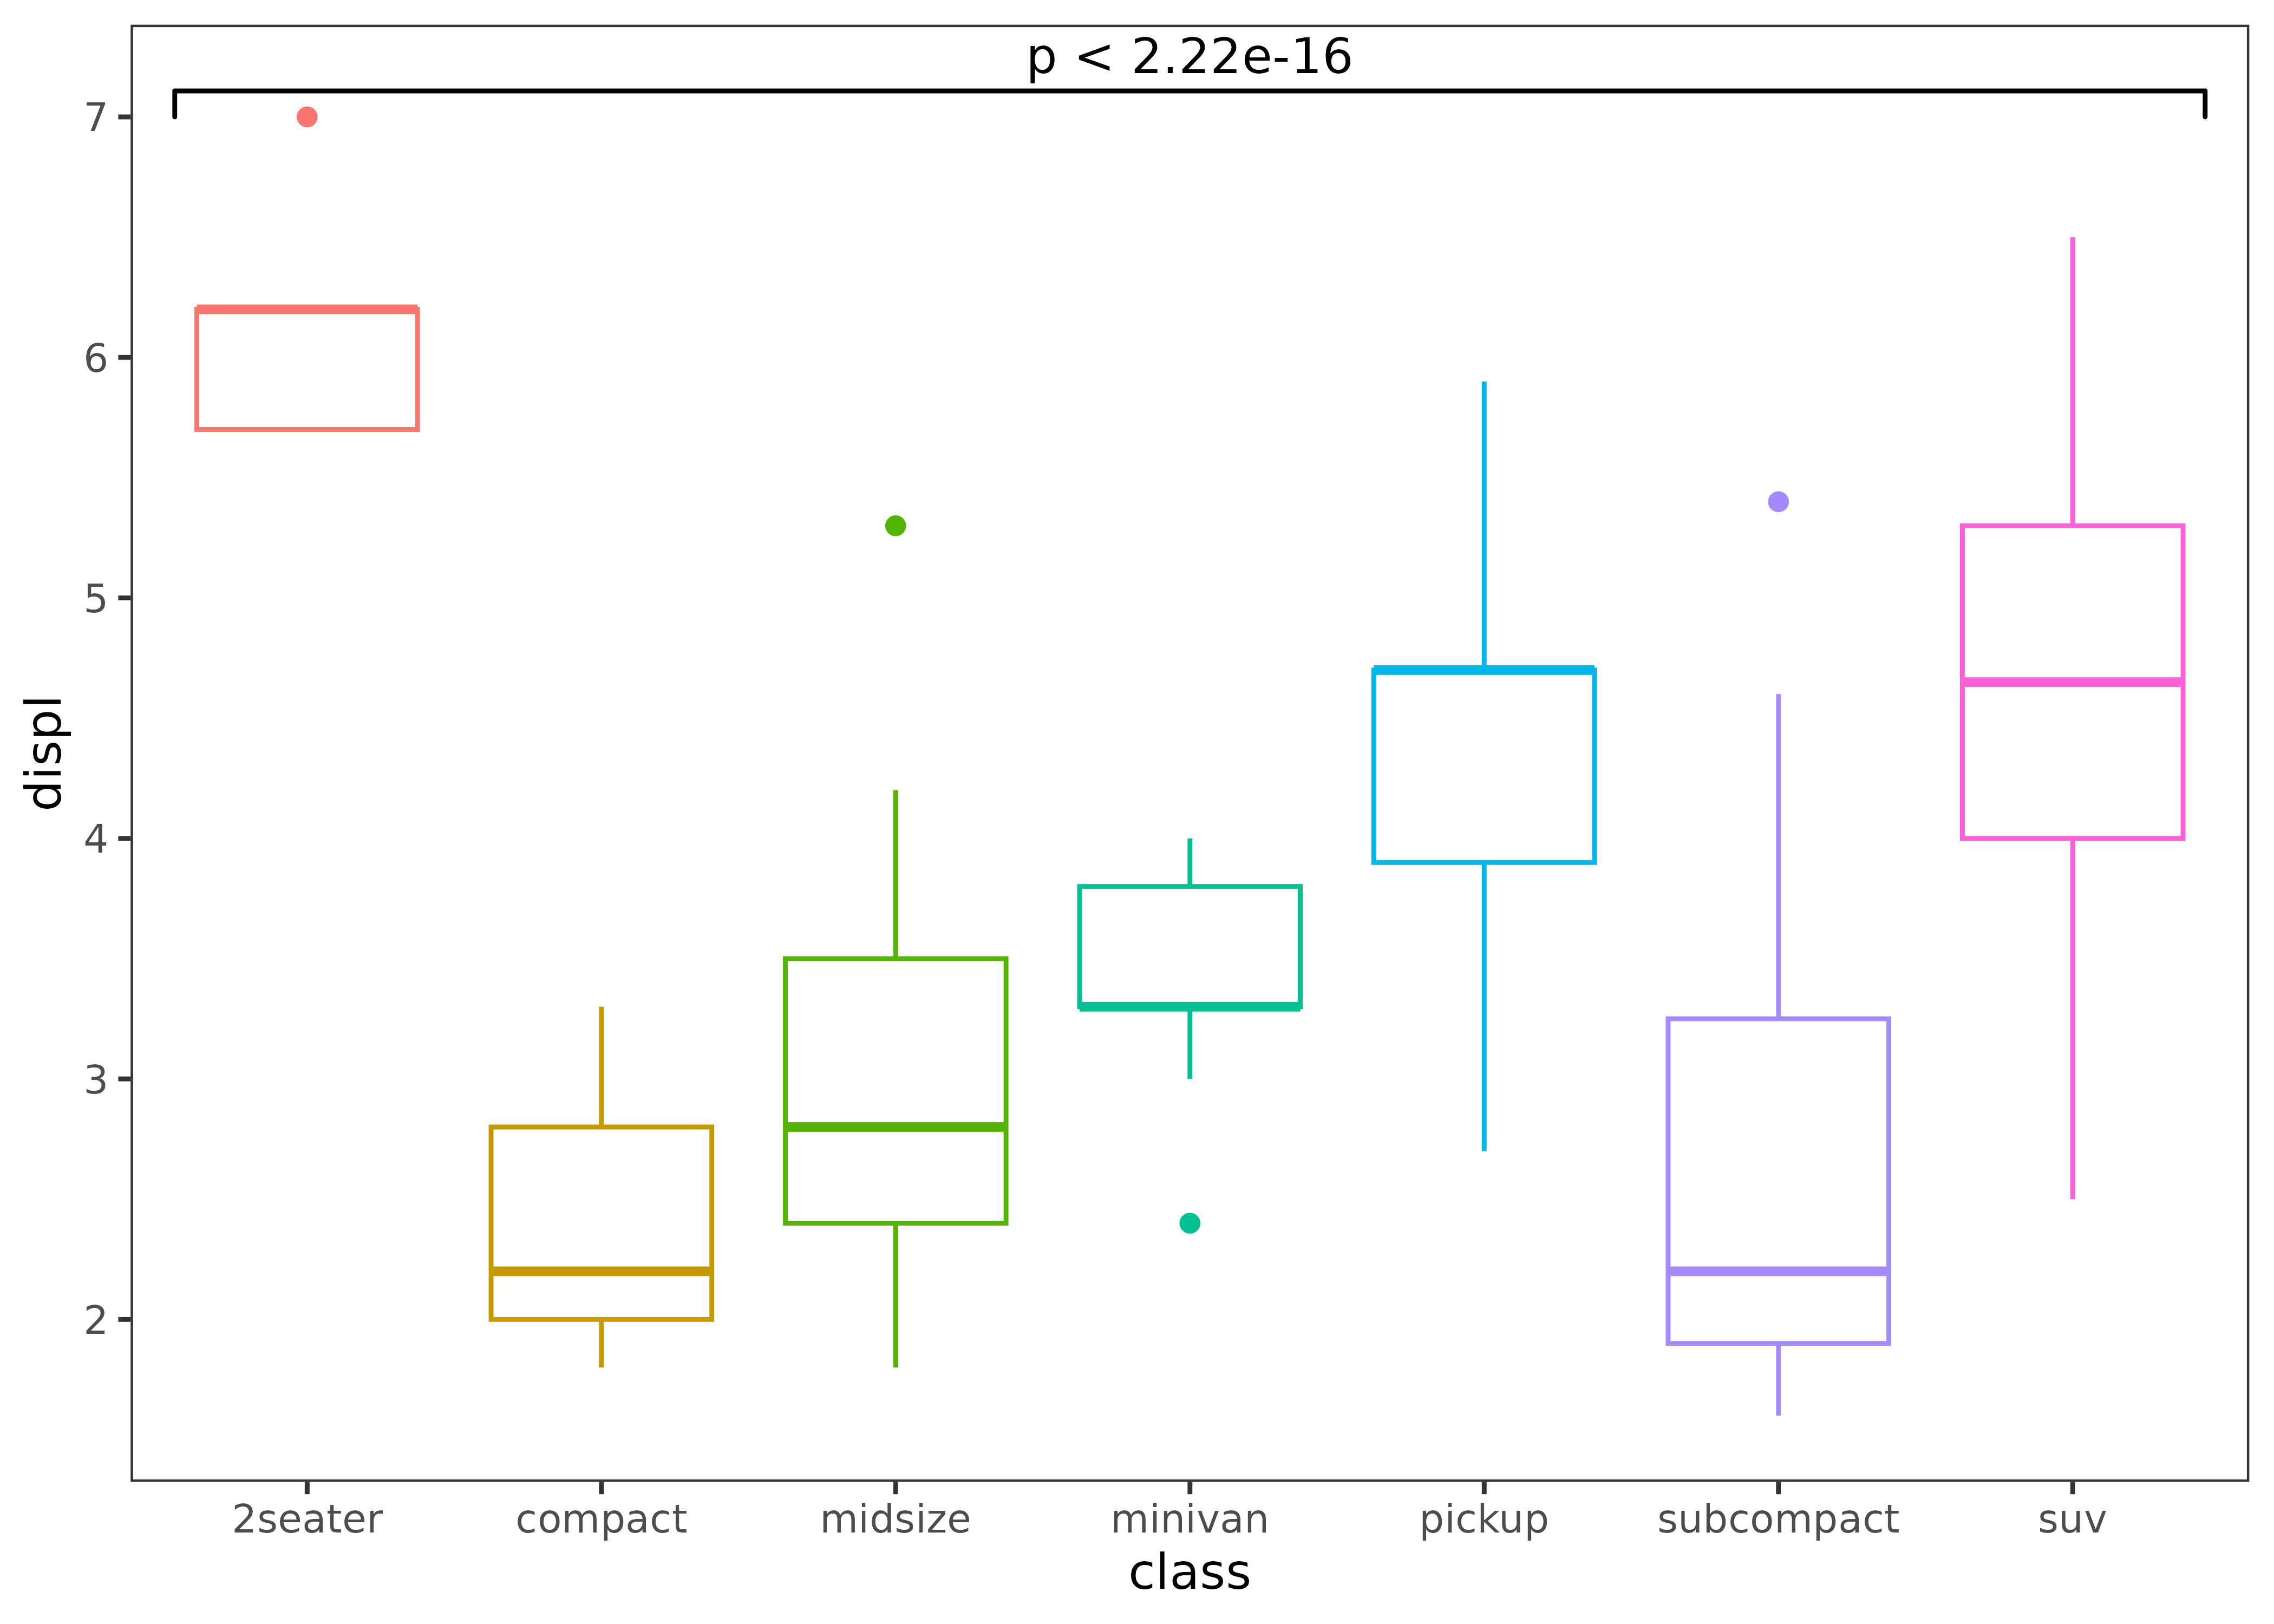
# If you just want to display text, you can set parameters "bracket" to FALSE.
p + stat_compare(bracket = FALSE)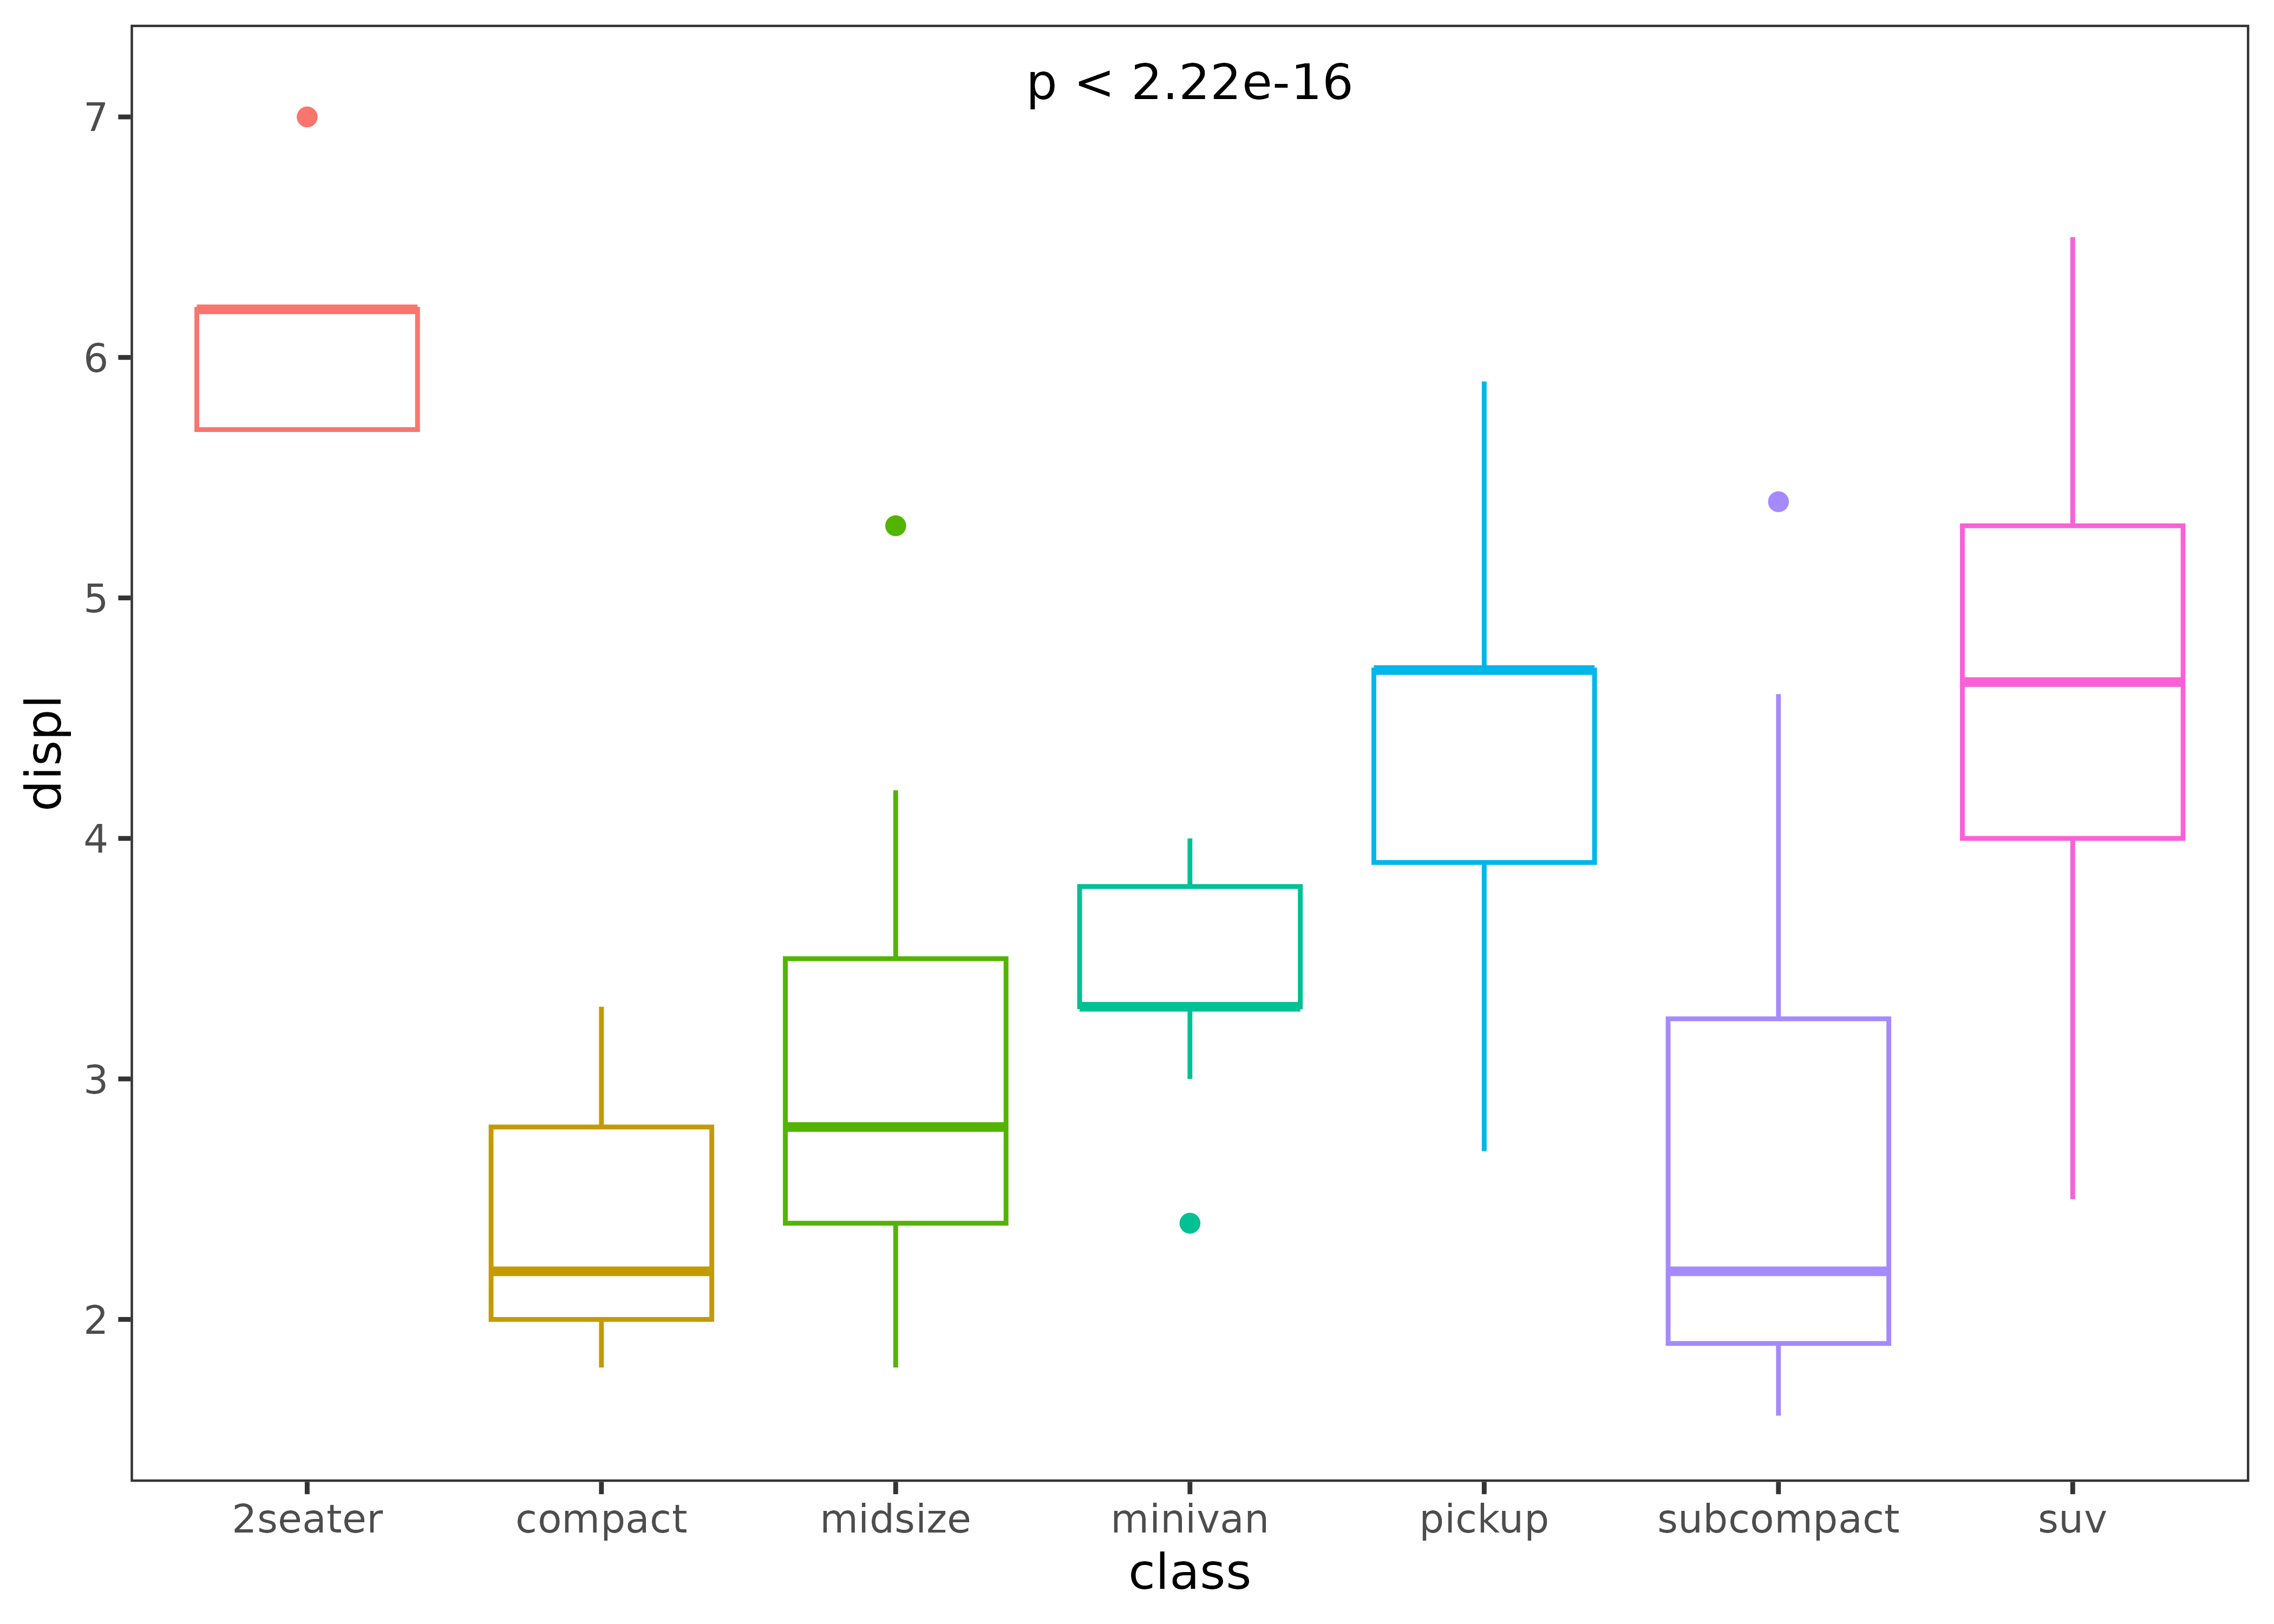
# If you want to display the test method, you can do this.
p + stat_compare(aes(label = after_stat(sprintf("%s: %s", method, label))))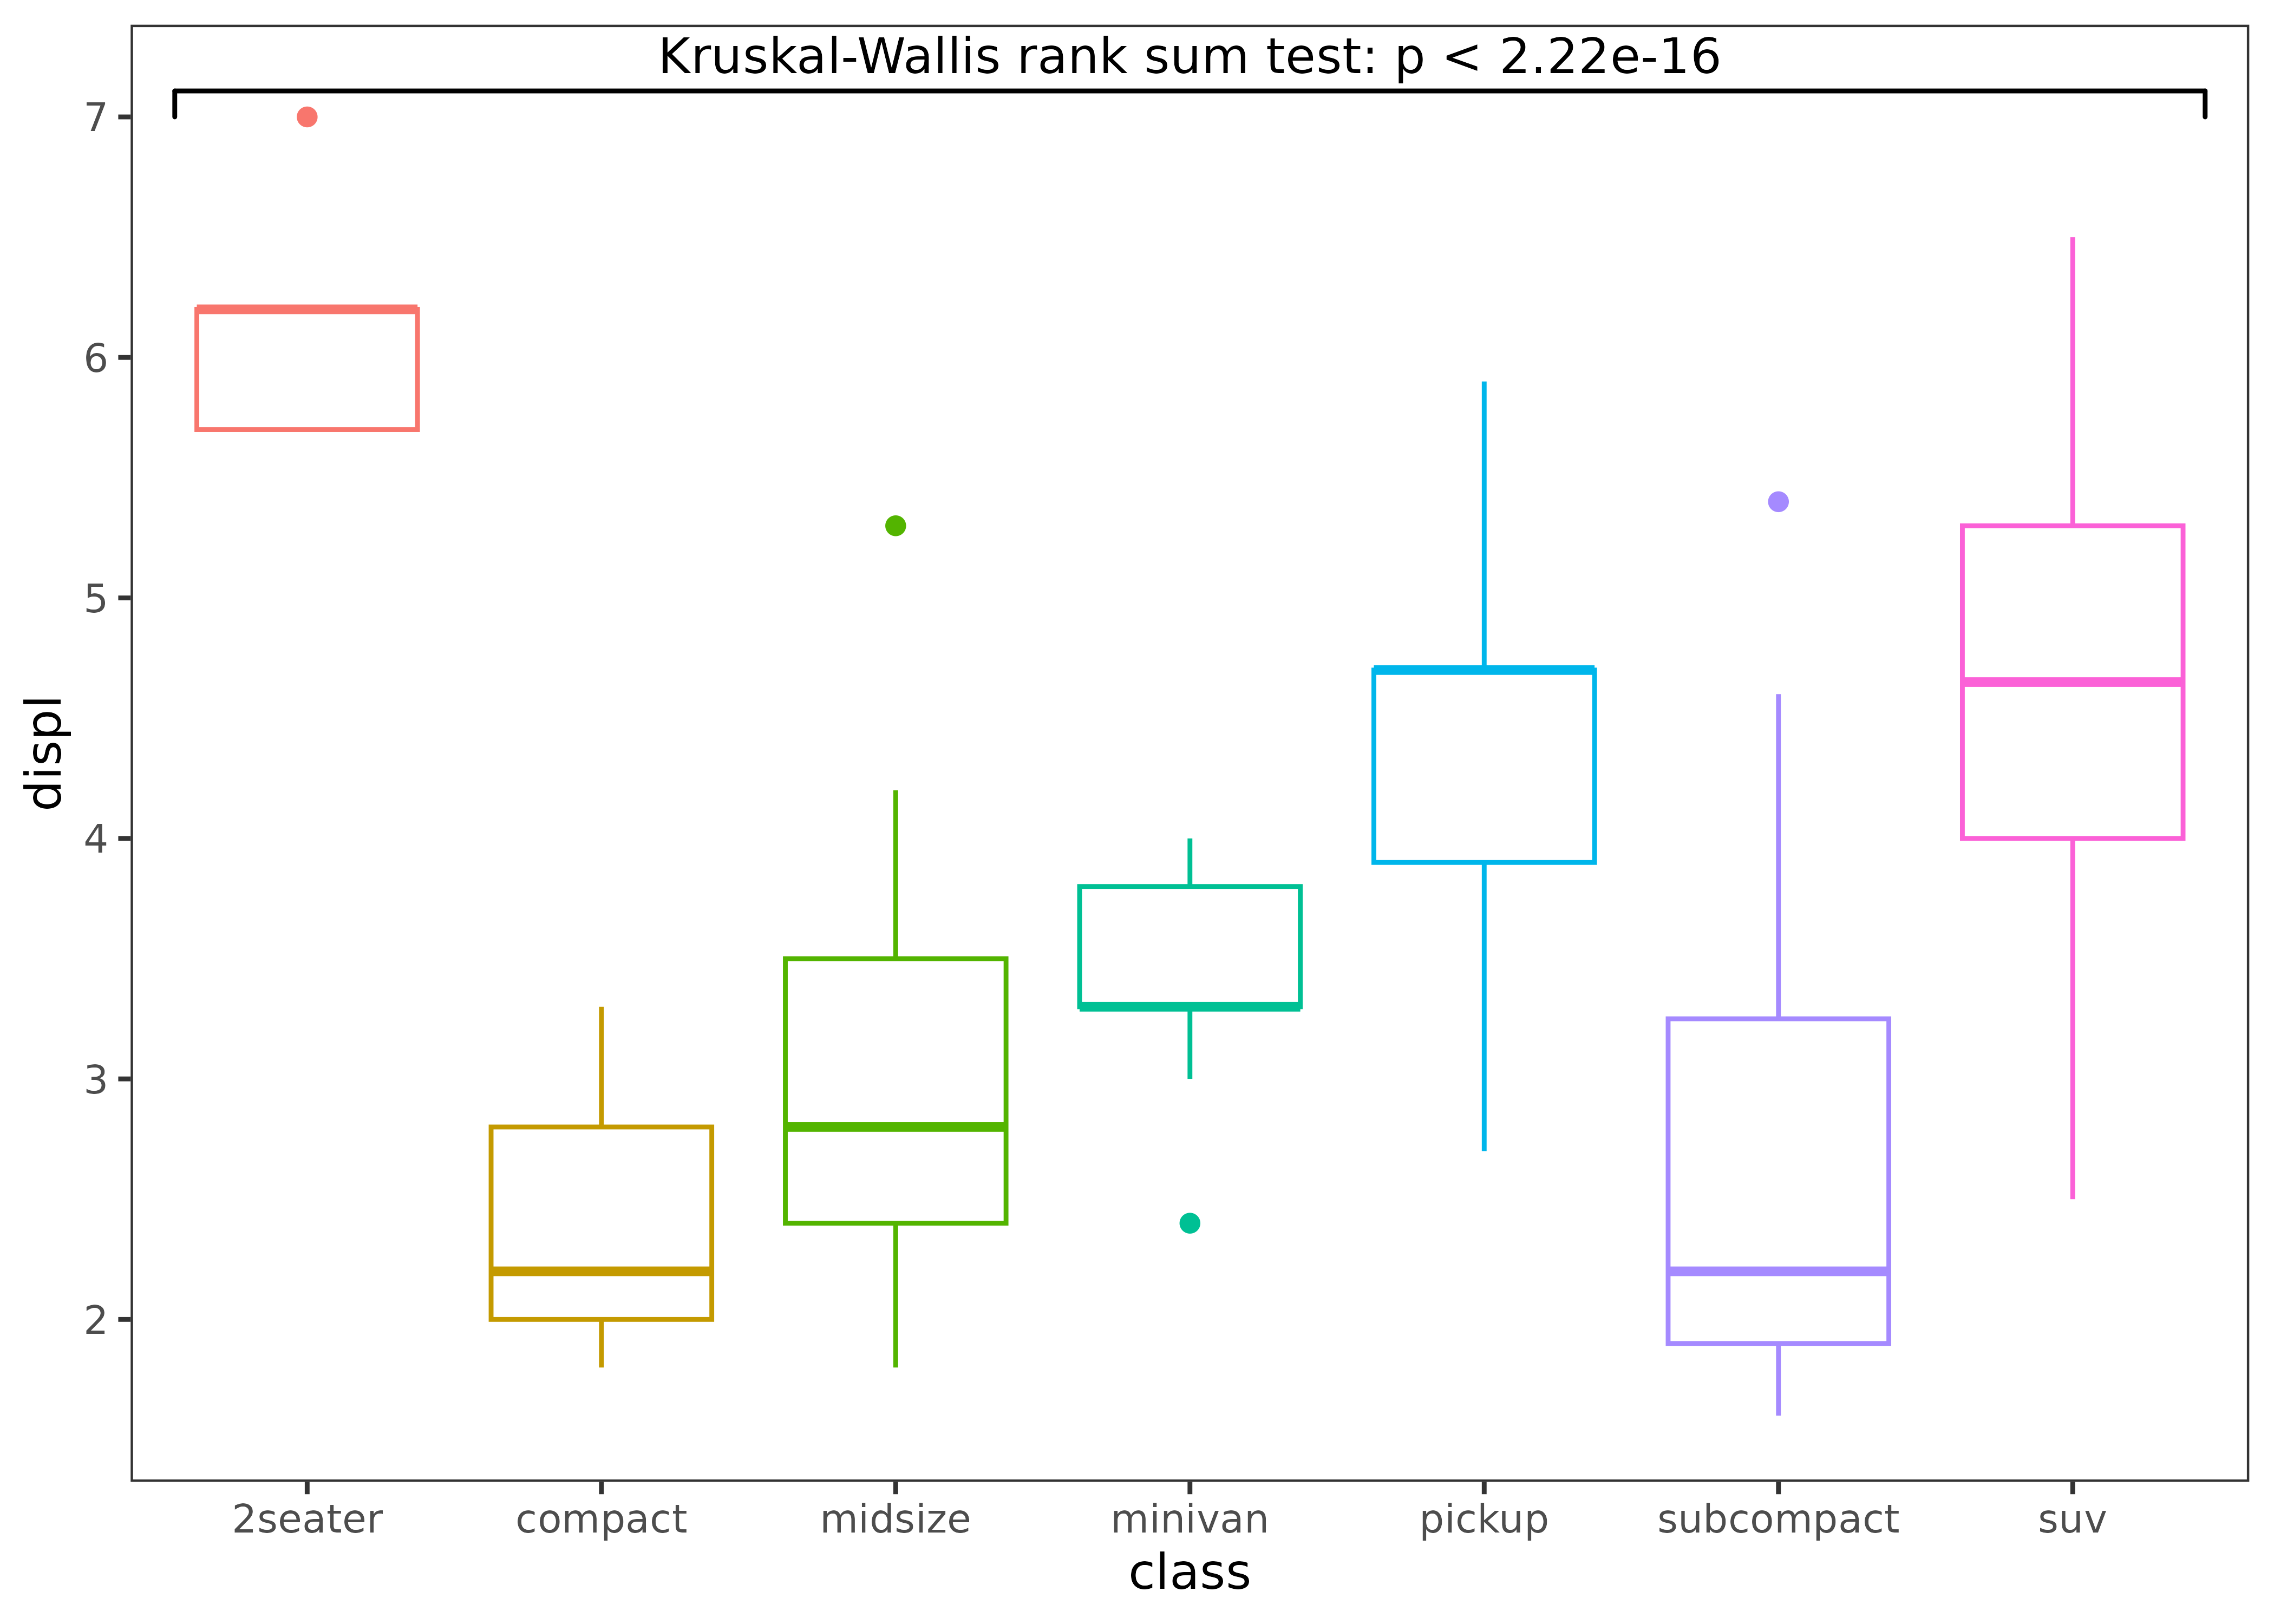
- Comparison between each group and other combined groups.
p + stat_compare(overall = TRUE)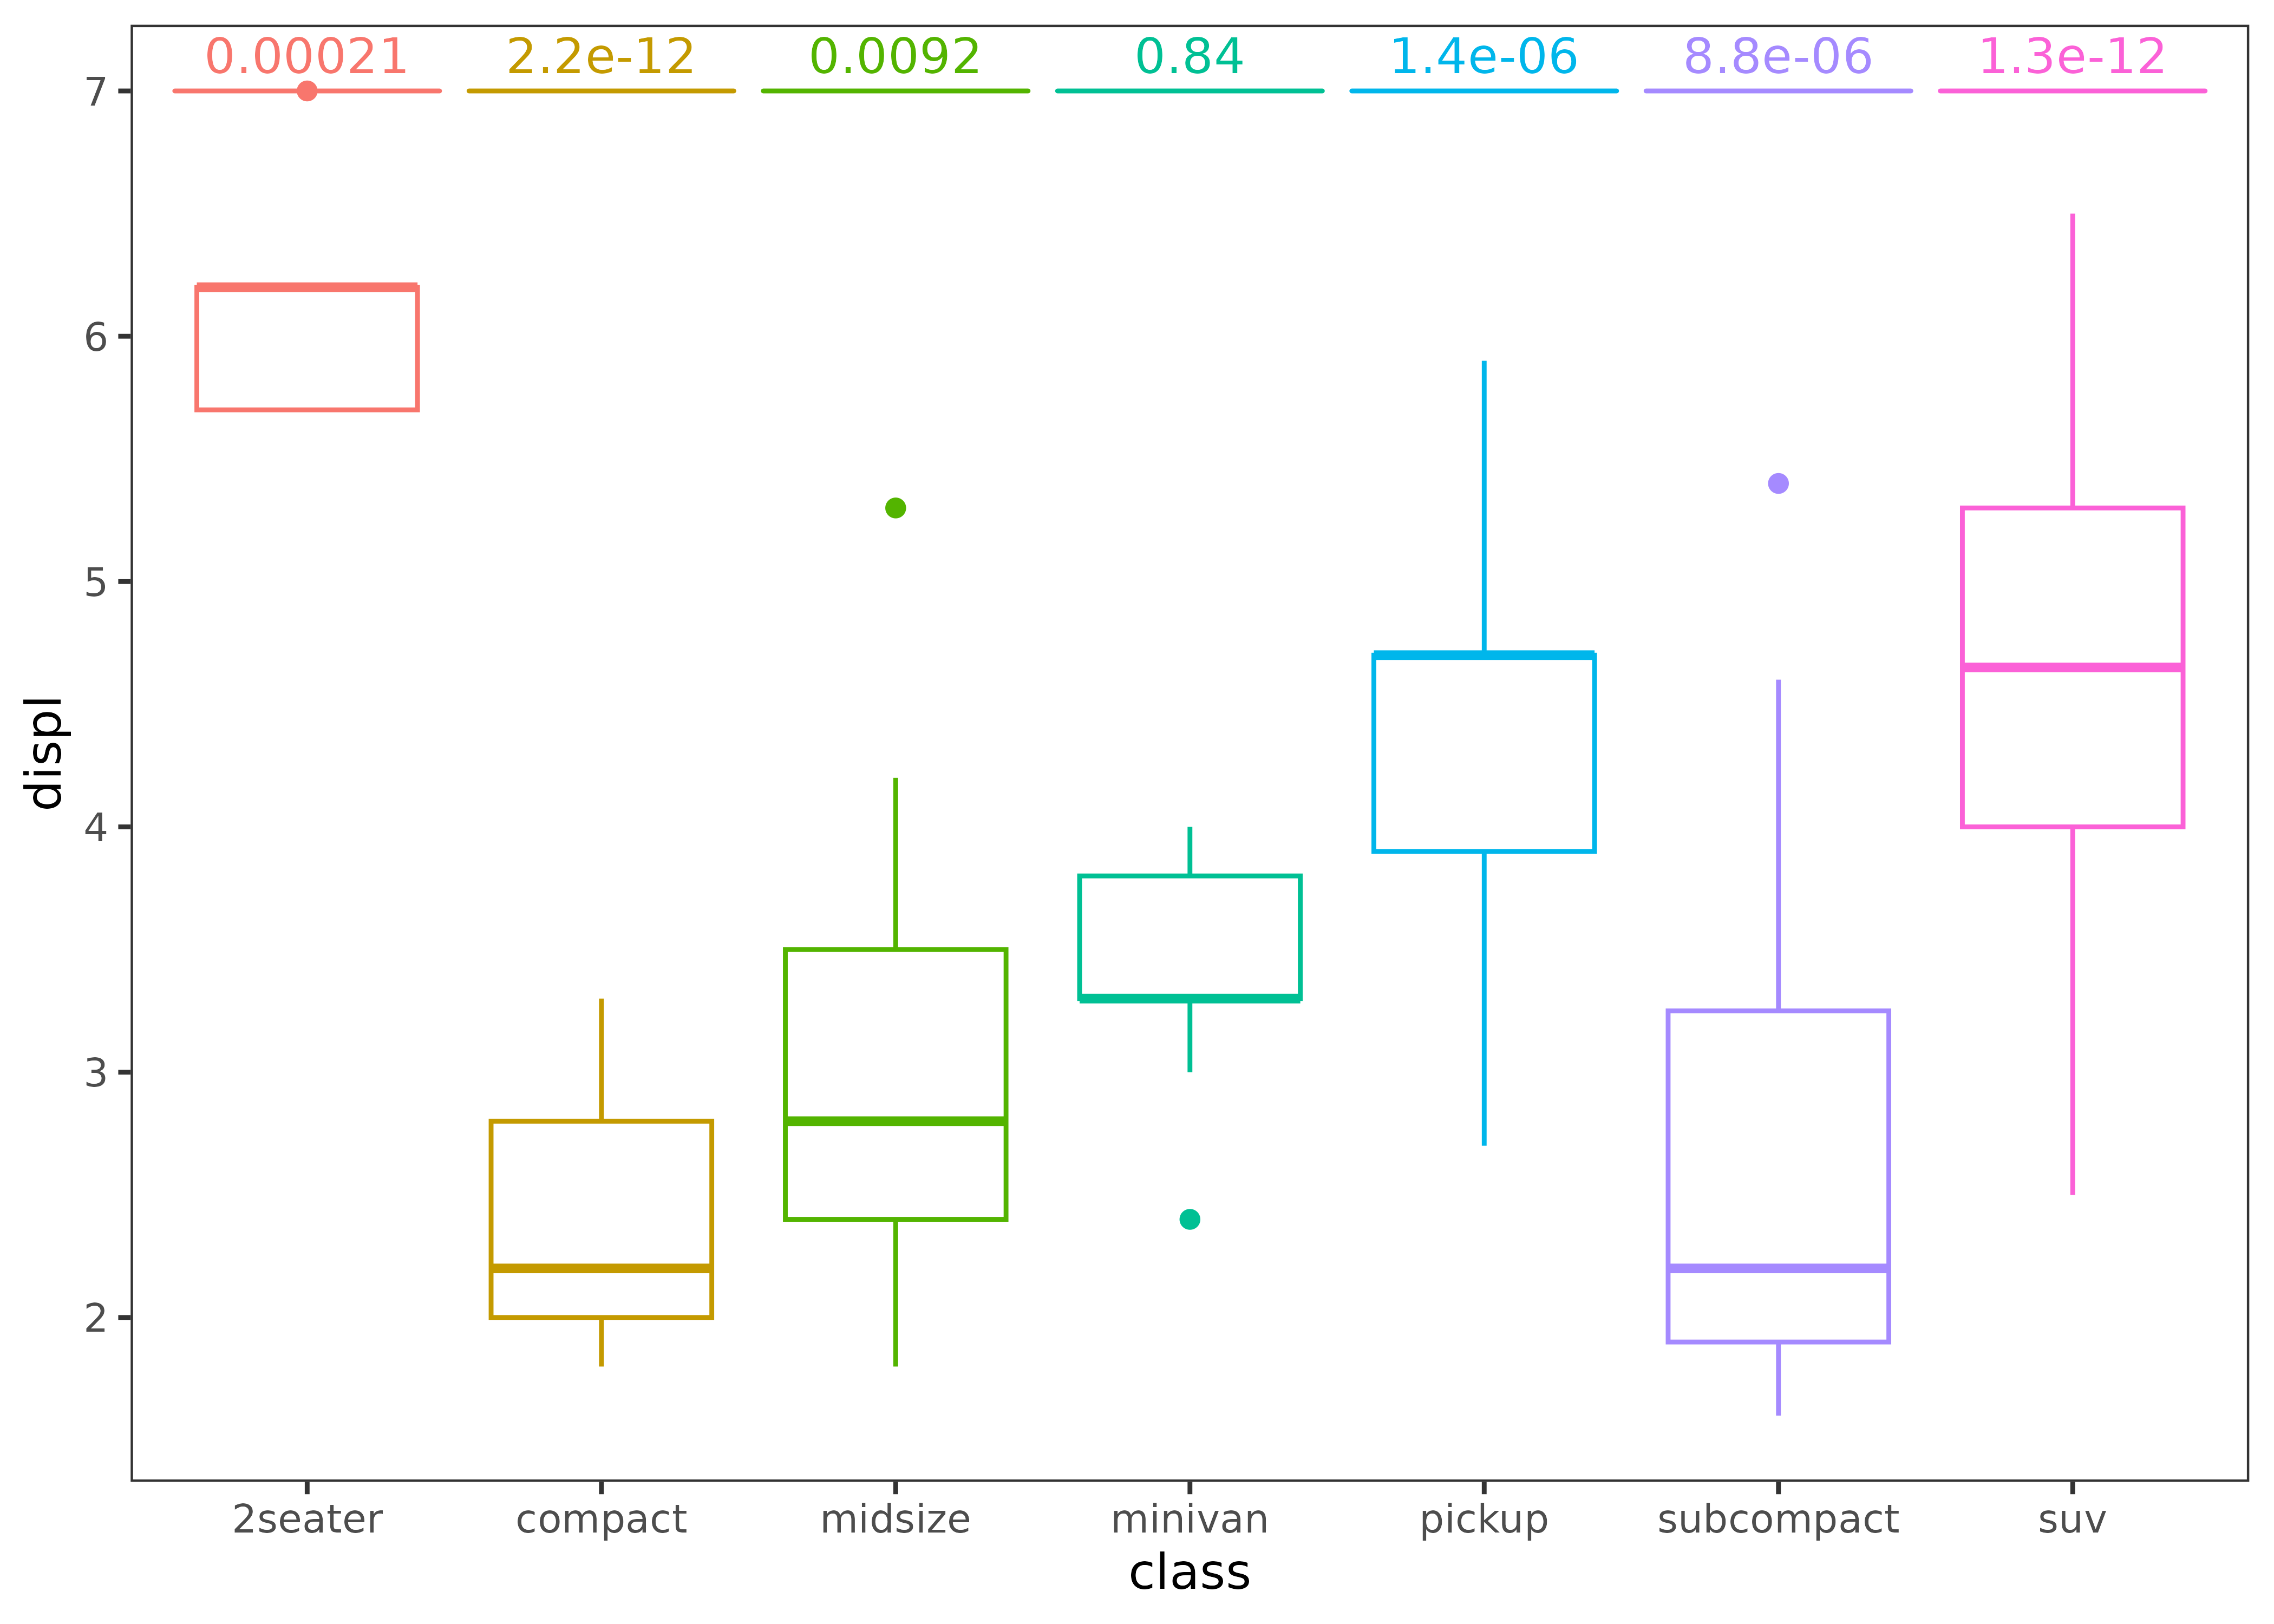
- Comparison between two groups: specify a reference group.
p + stat_compare(ref_group = "minivan")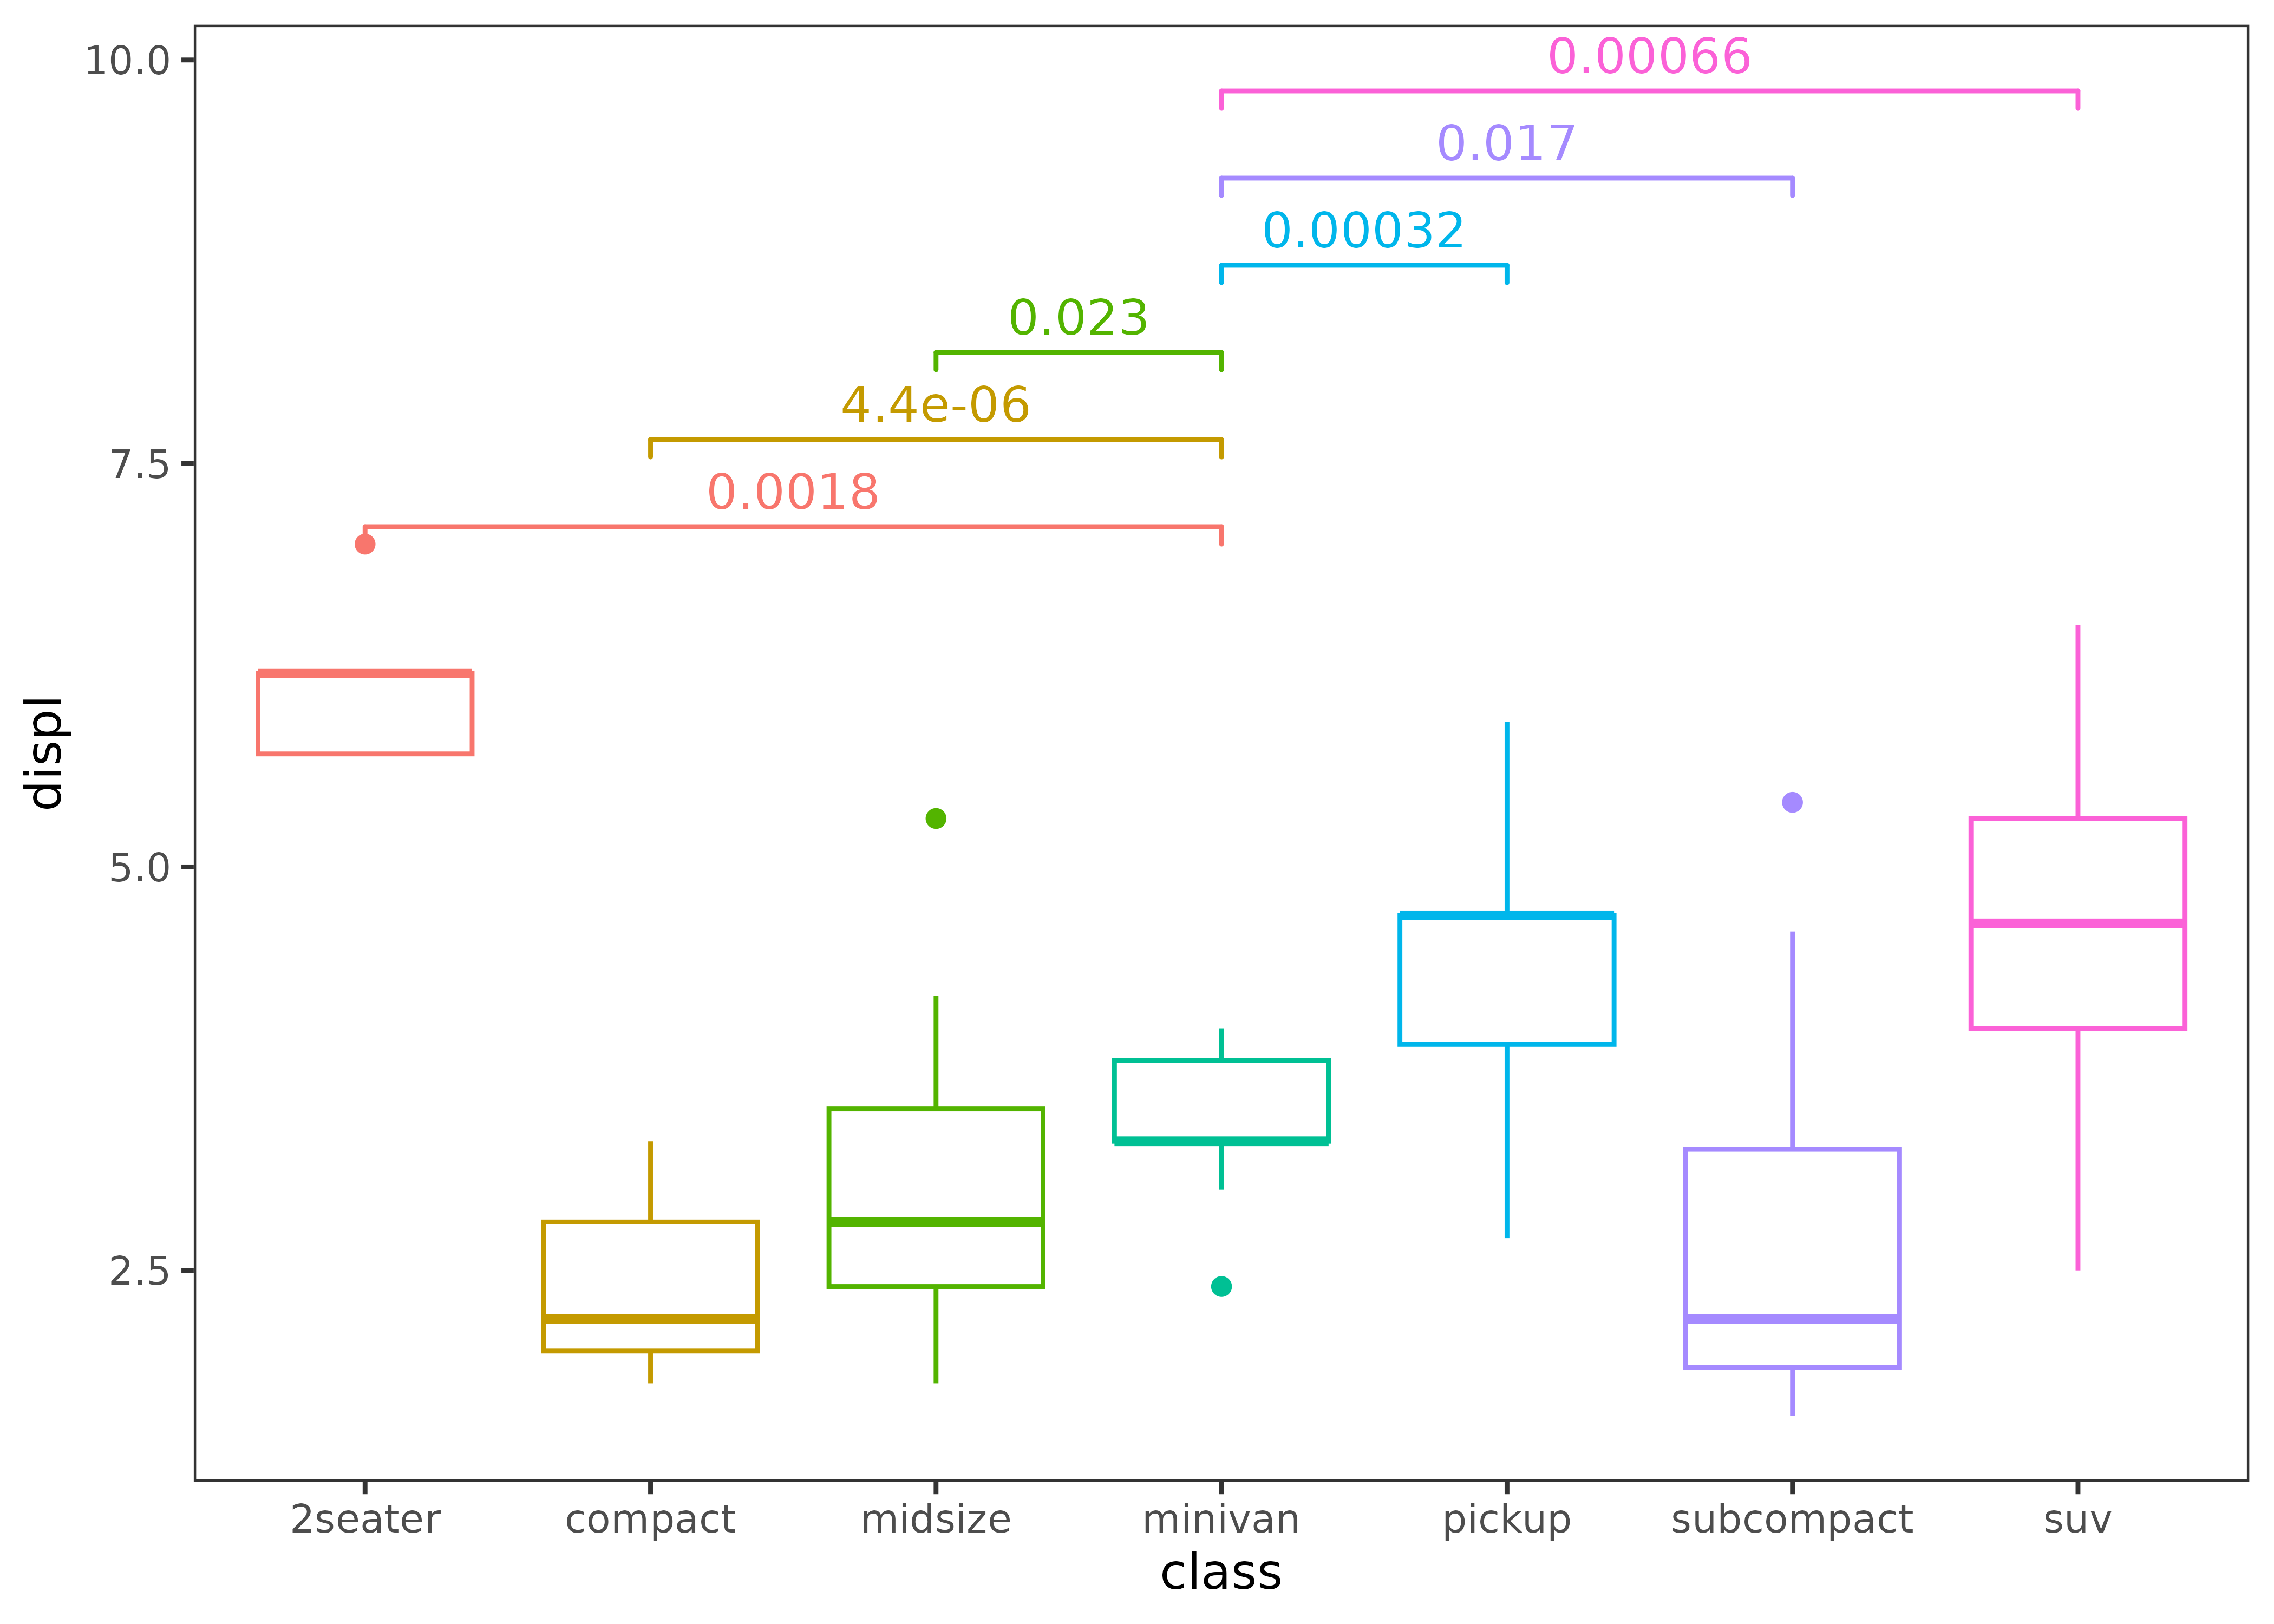
# If you only want to display the p-value less or equal to 0.01, you can do this.
p + stat_compare(ref_group = "minivan", cutoff = 0.01)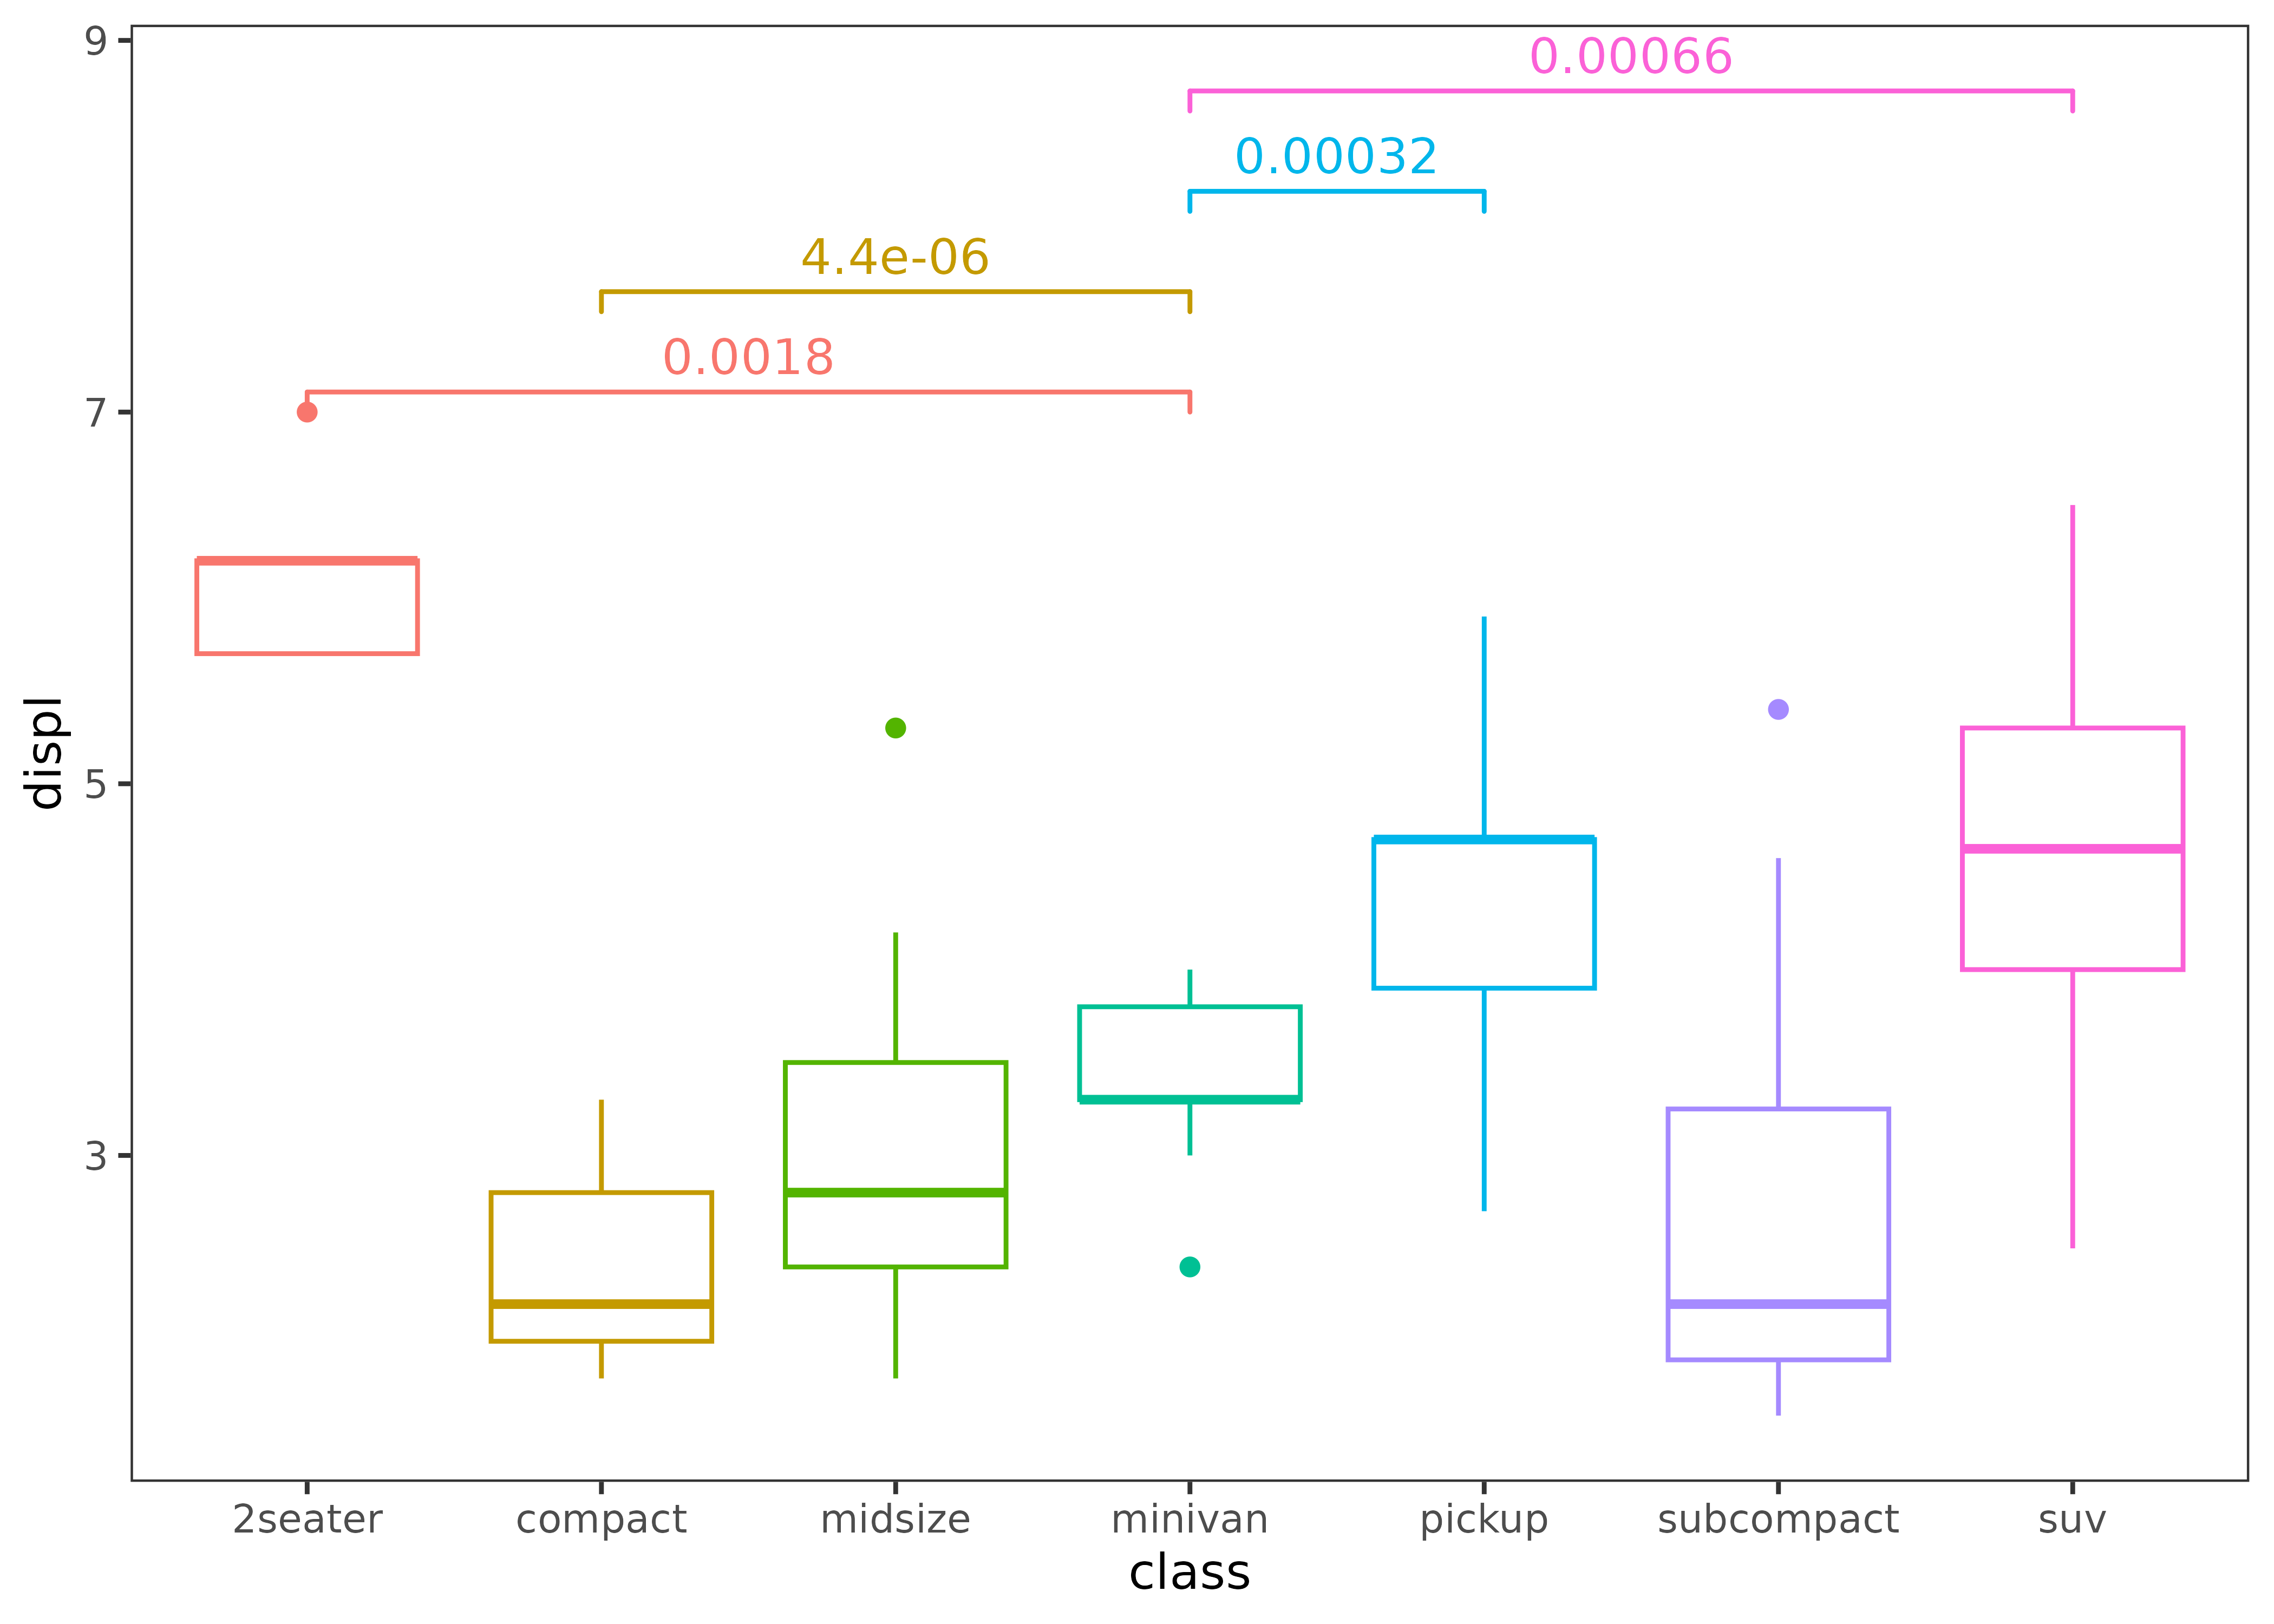
# If you want to display the significance level, you can do this.
p + stat_compare(ref_group = "minivan", breaks = c(0, 0.001, 0.01, 0.05, 1))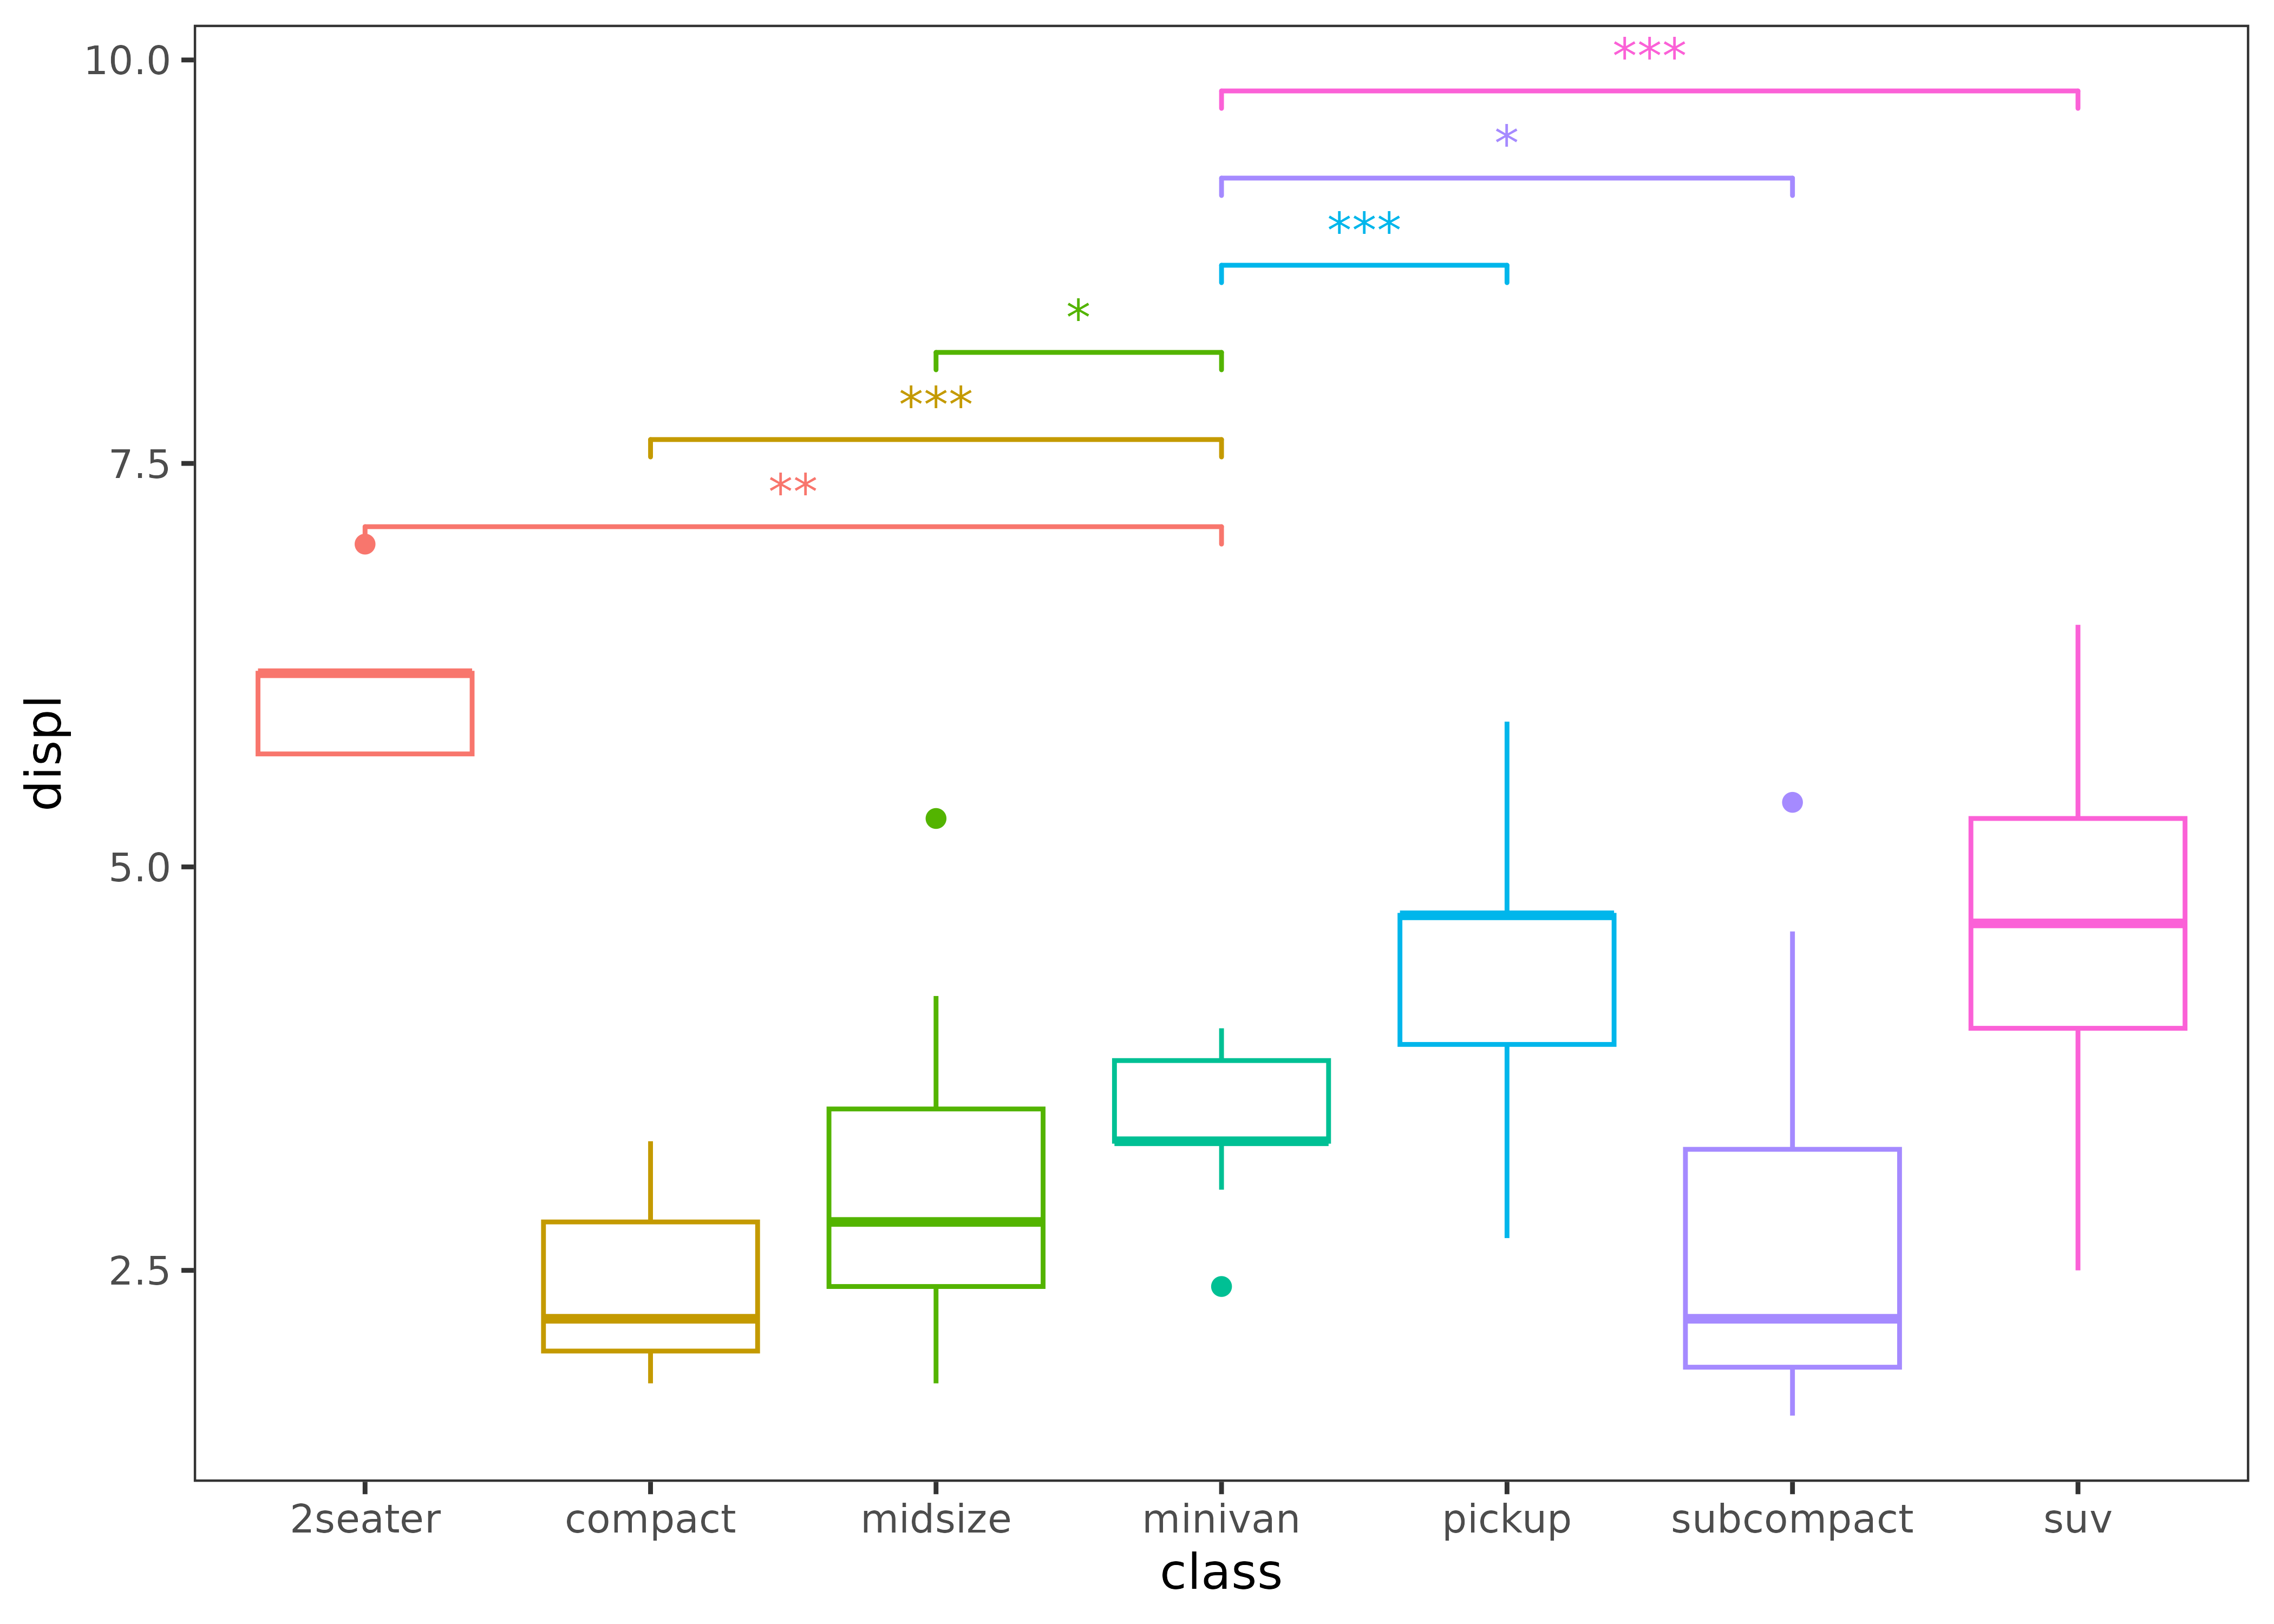
- Comparison between two groups: specify the comparison group.
p + stat_compare(tip_length = 0.05,
                 step_increase = 0,
                 comparisons = list(c("compact", "midsize"), c("pickup", "suv")),
                 arrow = grid::arrow(type = "closed", length = unit(0.1, "inches"))) # Yeah, this supports adding arrows.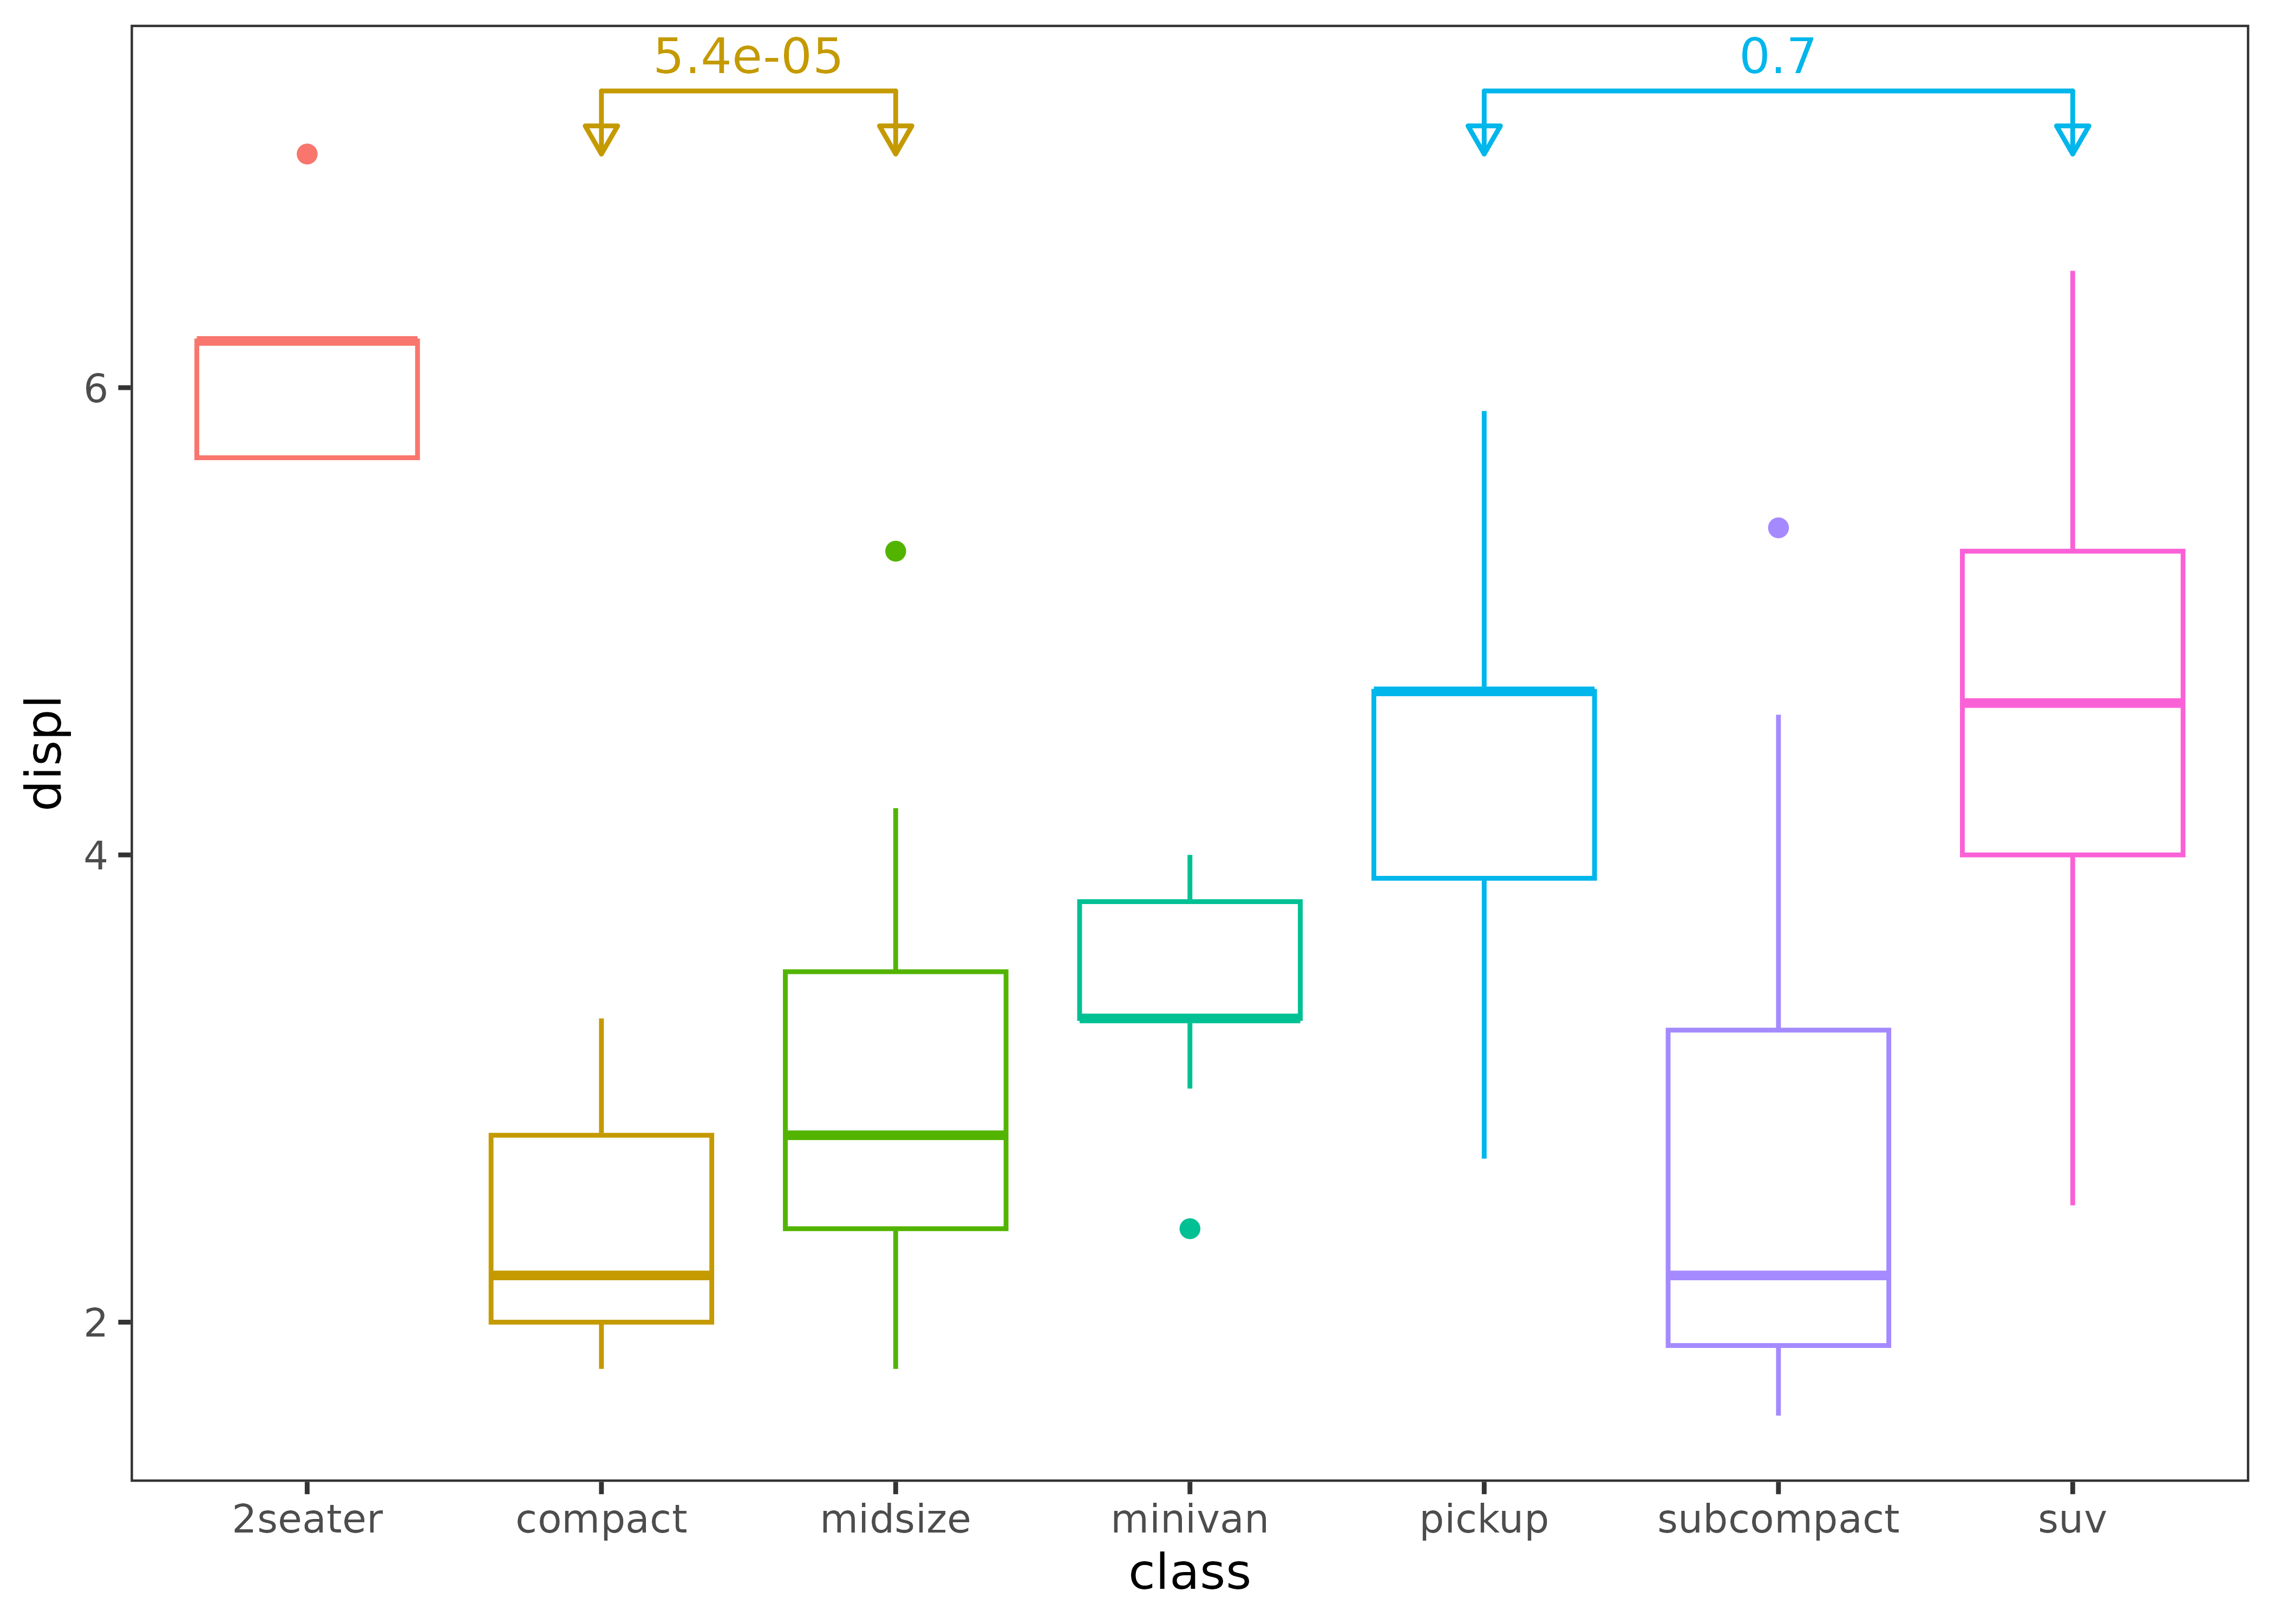
- Within-group (grouped by the x-axis) population comparison.
ggplot(mpg, aes(drv, displ, fill = class)) +
  geom_boxplot() +
  stat_compare() +
  stat_compare(aes(group = drv), nudge = 0.1, color = "gray") + # add global comparison
  theme_test()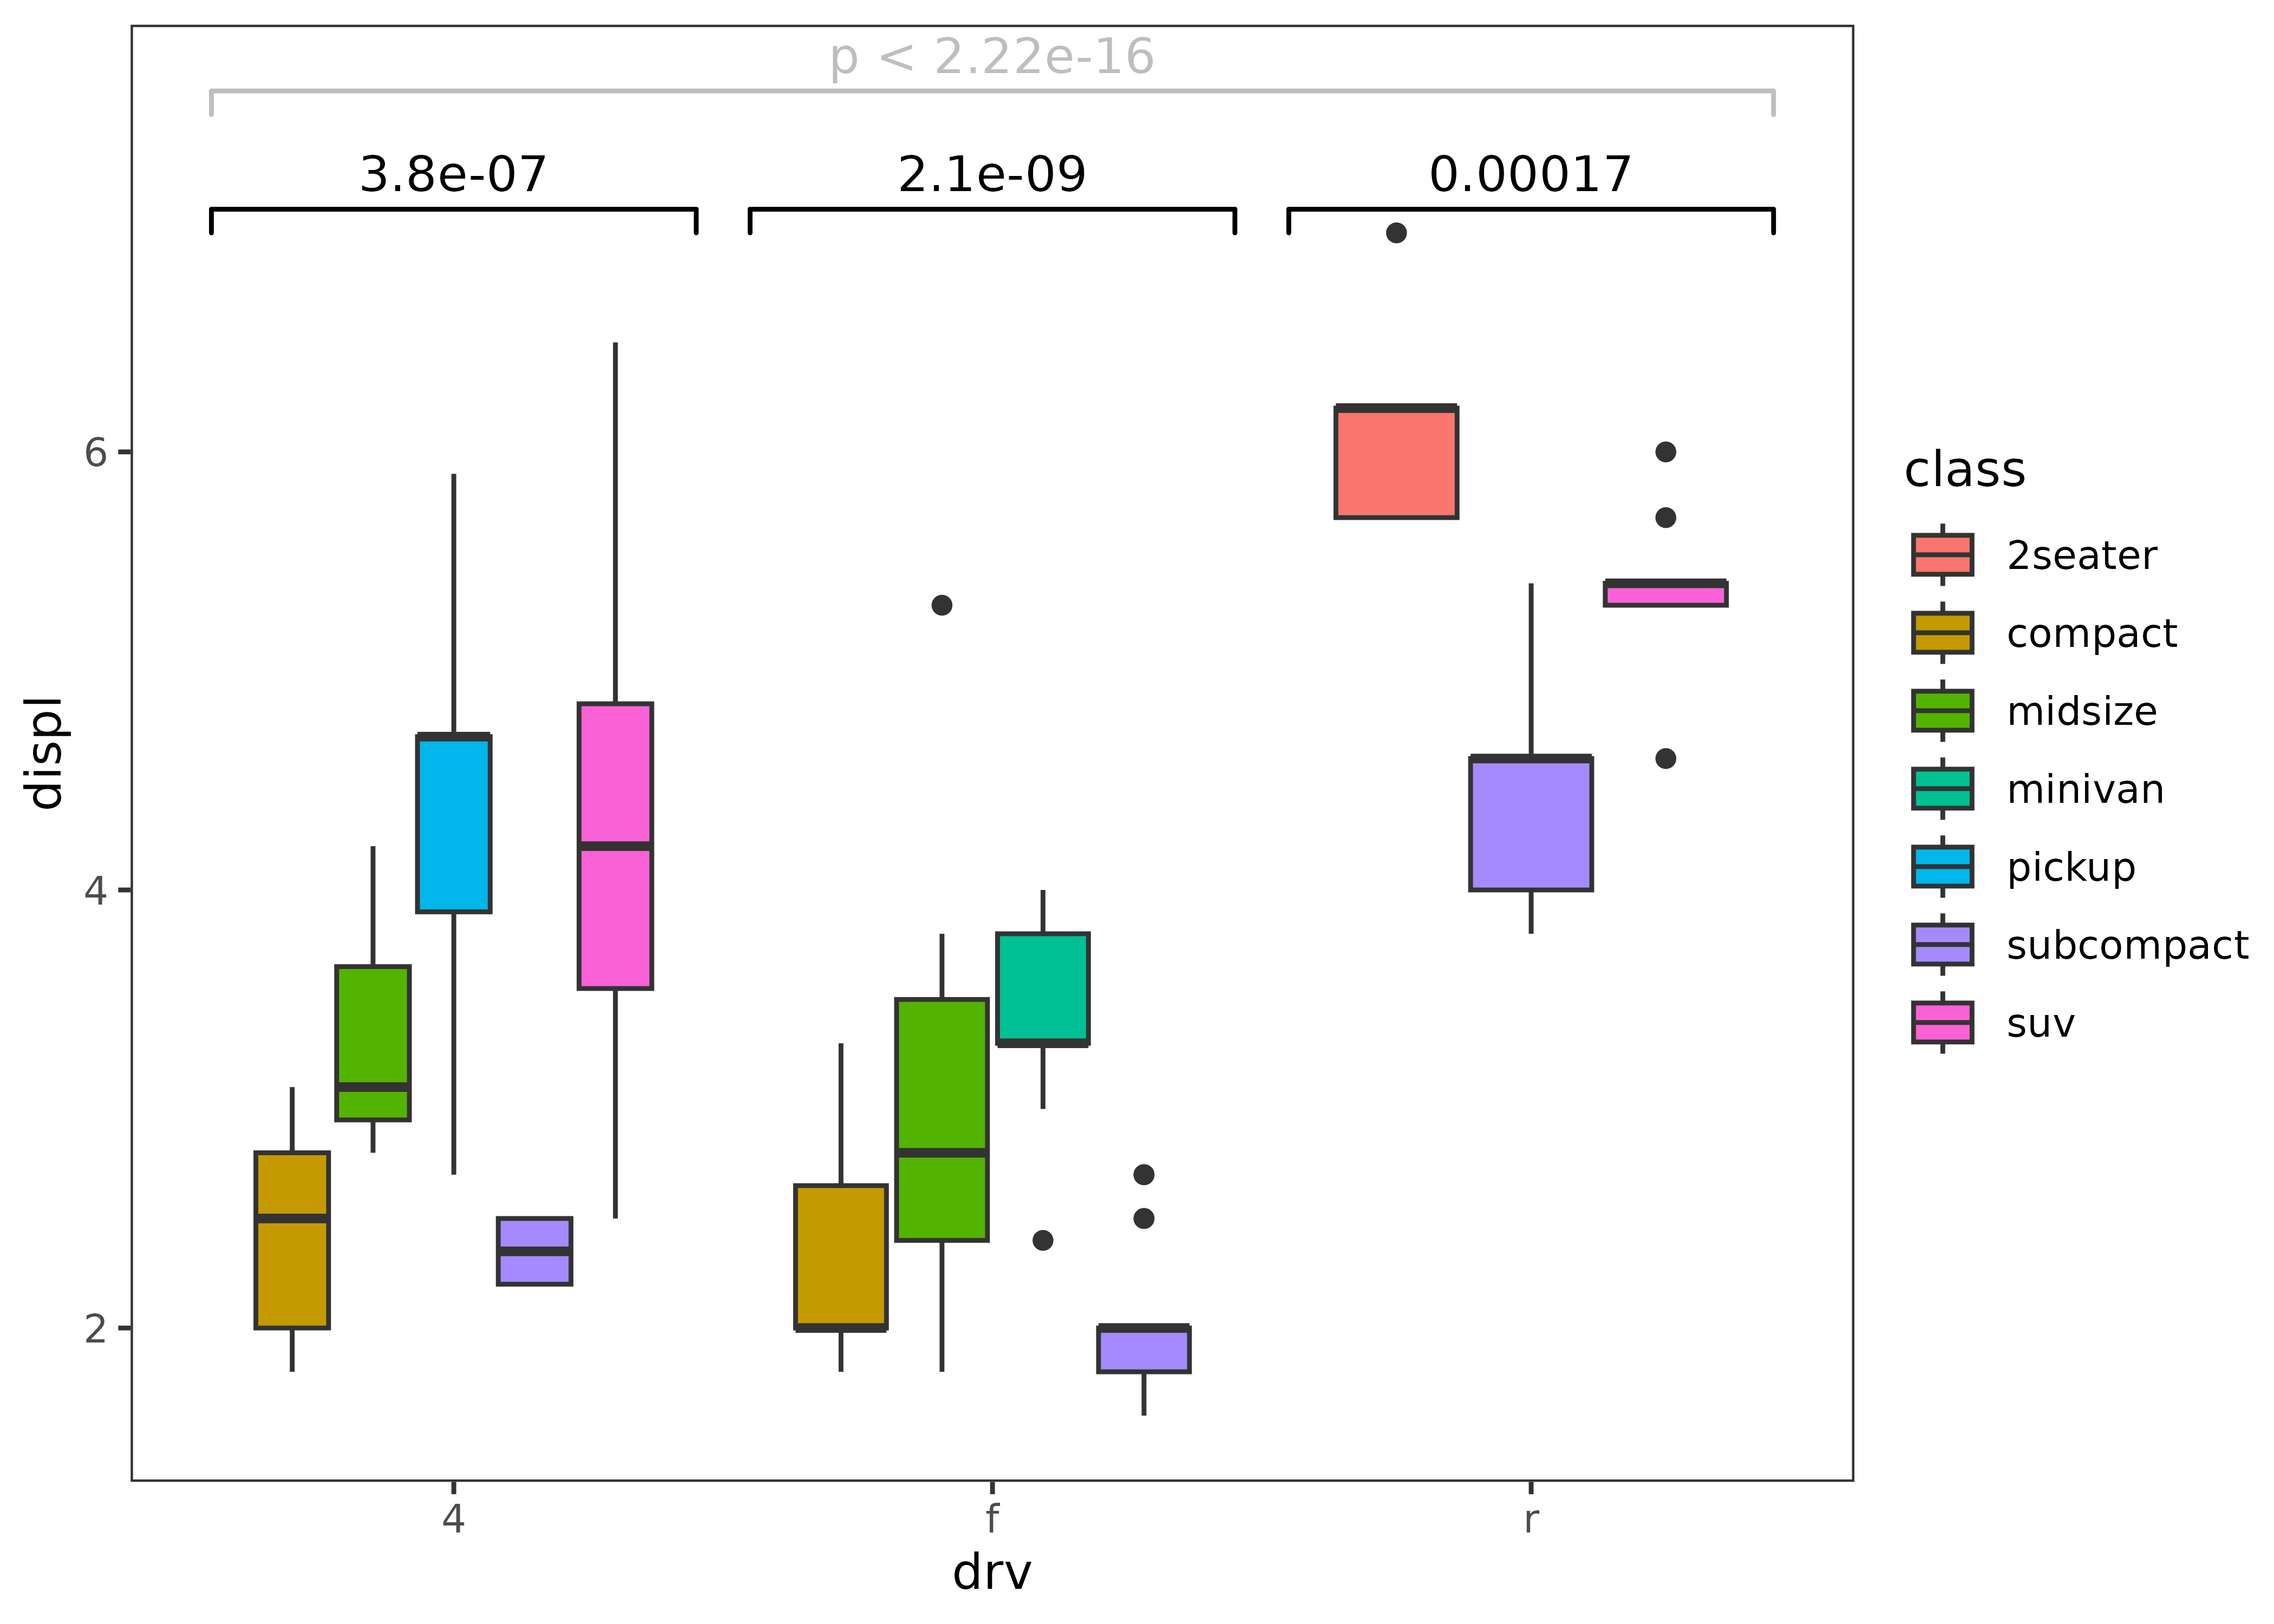
Enhancement
- Better adaptation to faceting.
ggplot(mpg, aes(drv, displ)) +
  geom_boxplot() +
  stat_compare(comparisons = combn(unique(mpg$drv), 2, simplify = FALSE)) +
  facet_grid(cols = vars(class), scales = "free") +
  theme_test()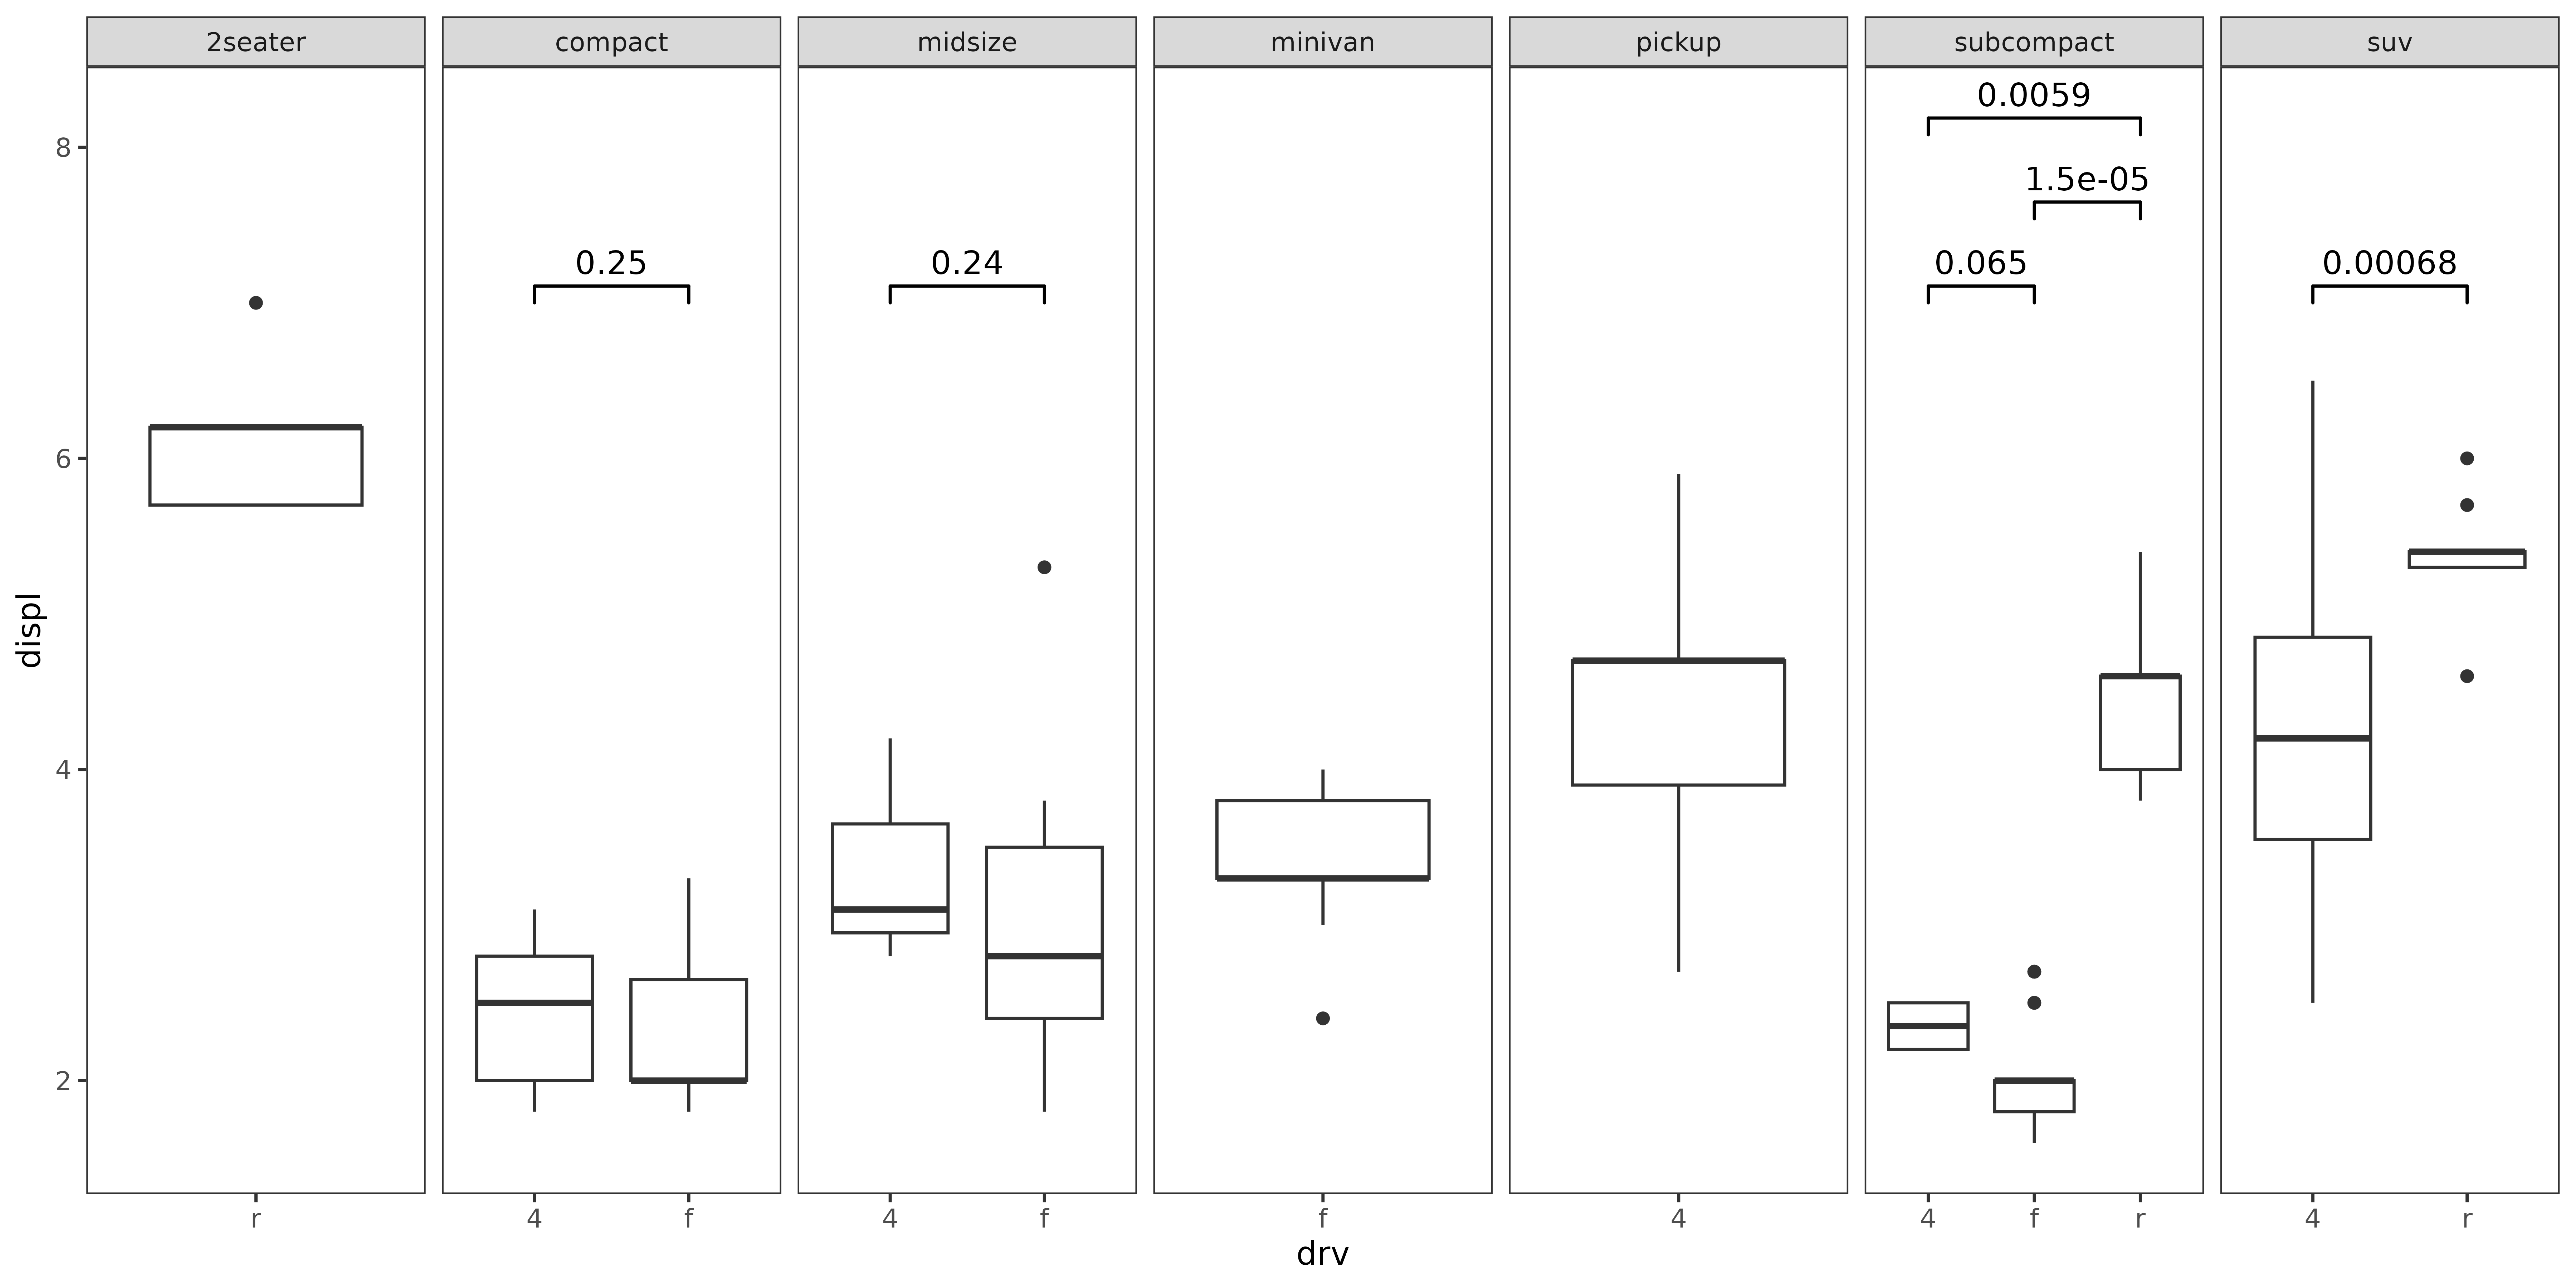
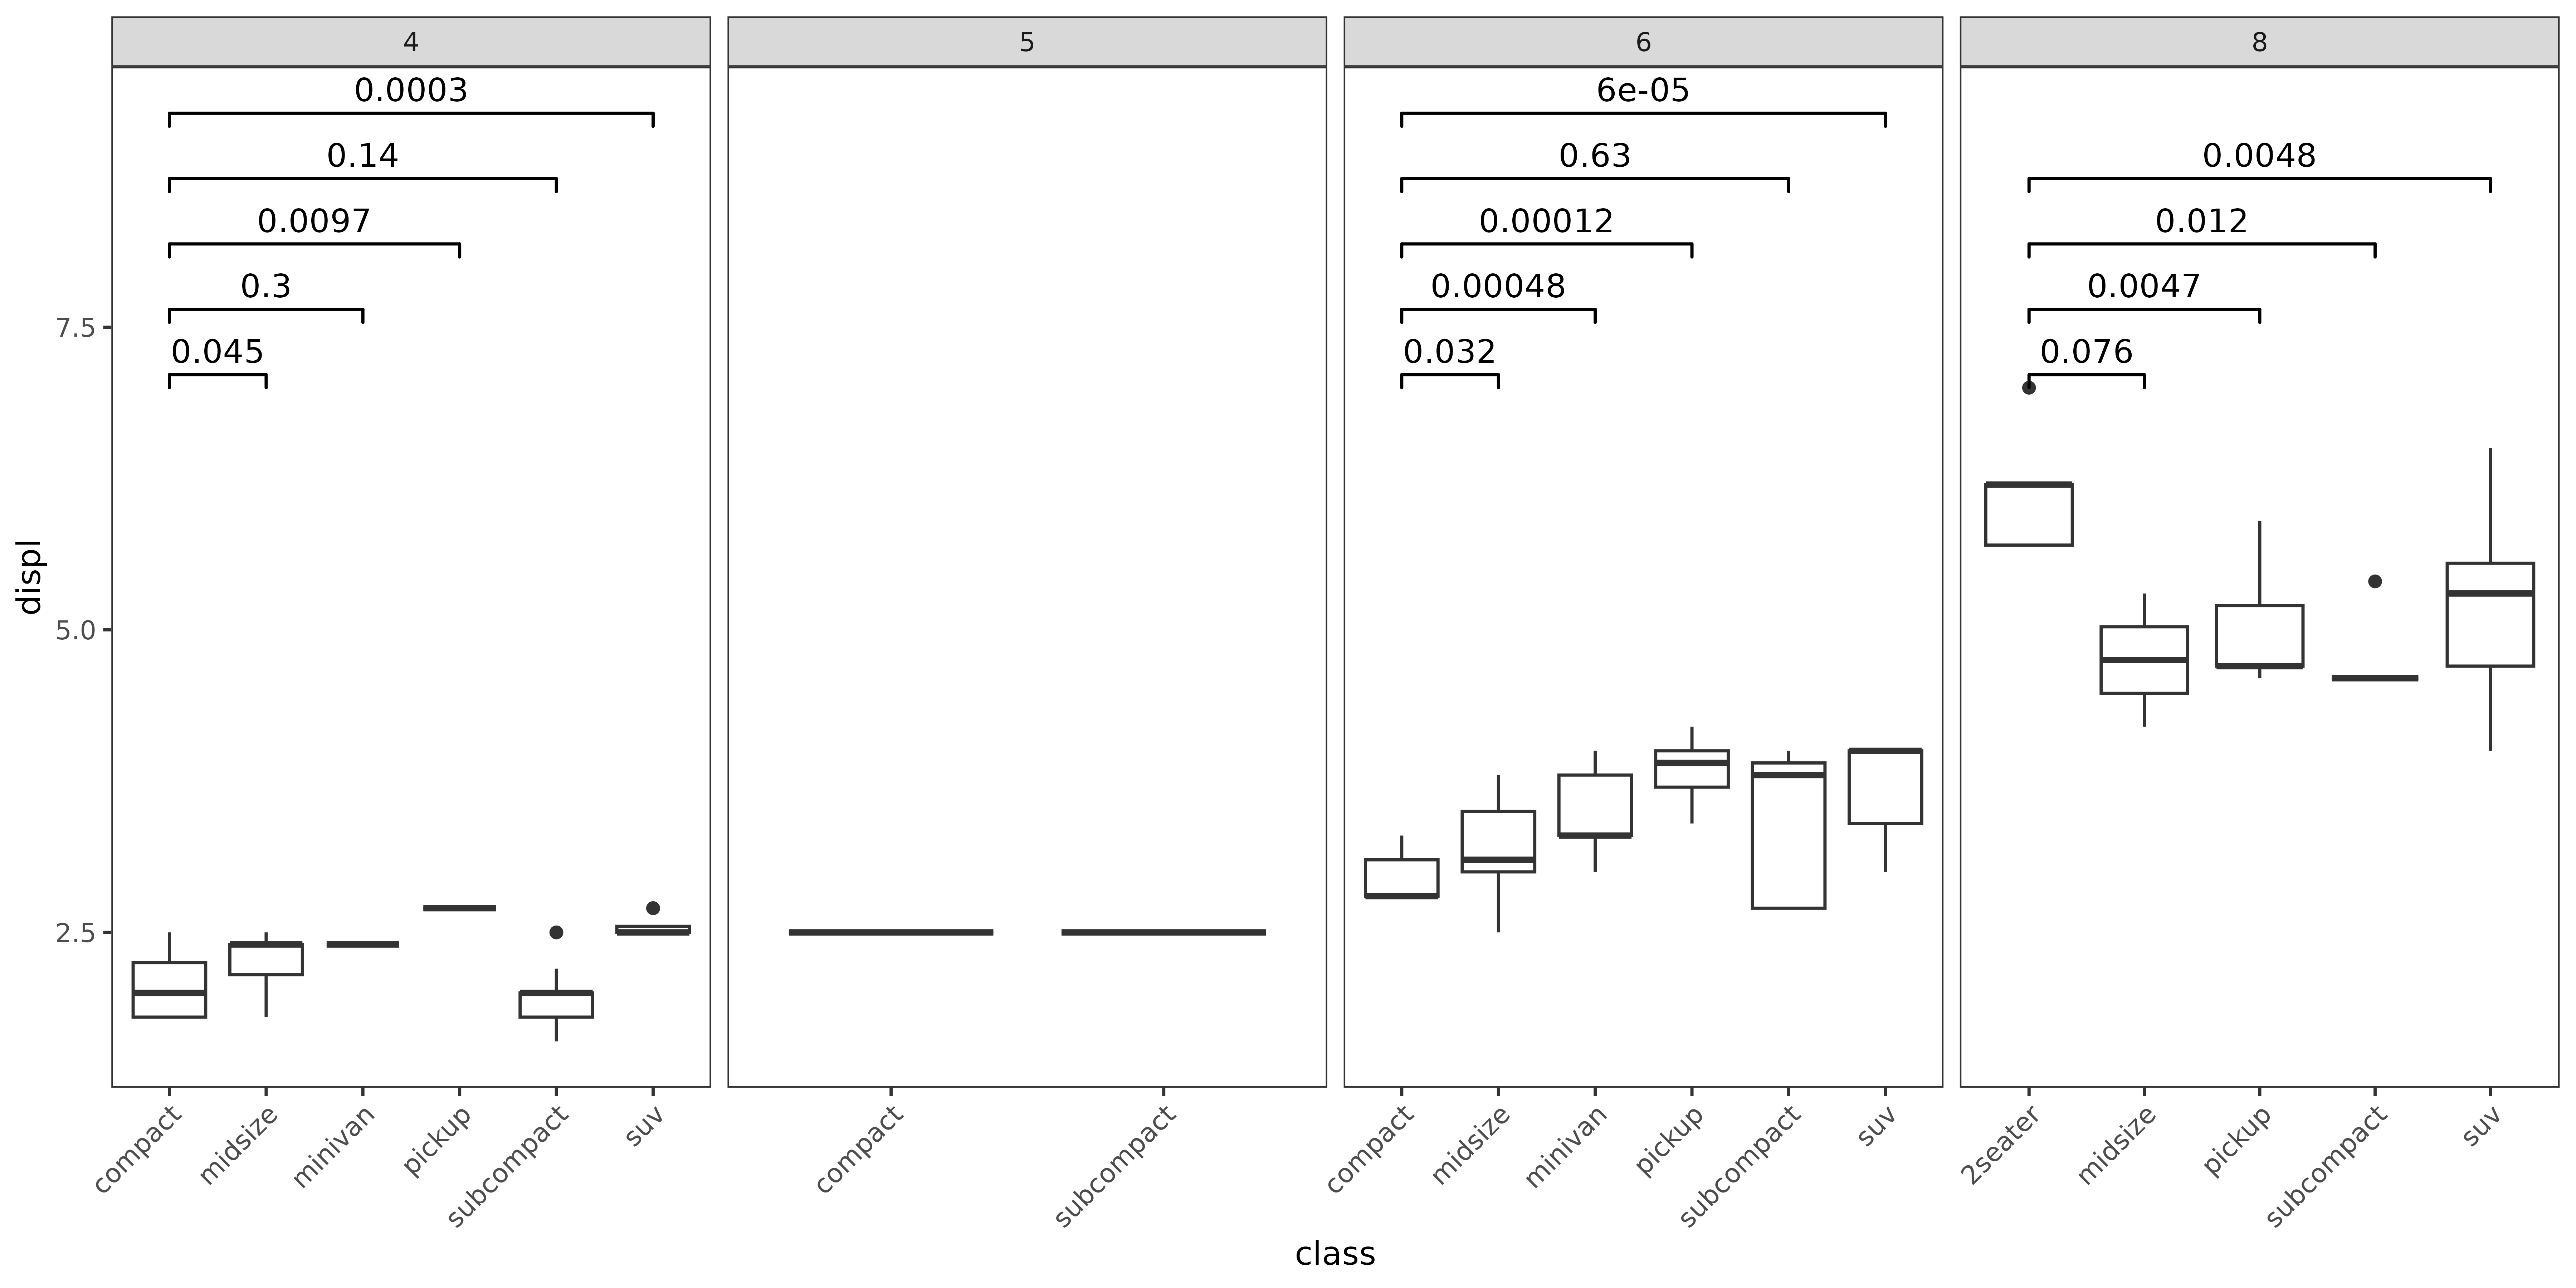
- P-value correction
p <- ggplot(mpg, aes(class, displ)) +
  geom_boxplot() +
  facet_grid(cols = vars(cyl), scales = "free") +
  theme_test() +
  theme(axis.text.x = element_text(angle = 45, hjust = 1))
# Layer-level P-value correction
p + stat_compare(ref_group = 1, correction = "fdr")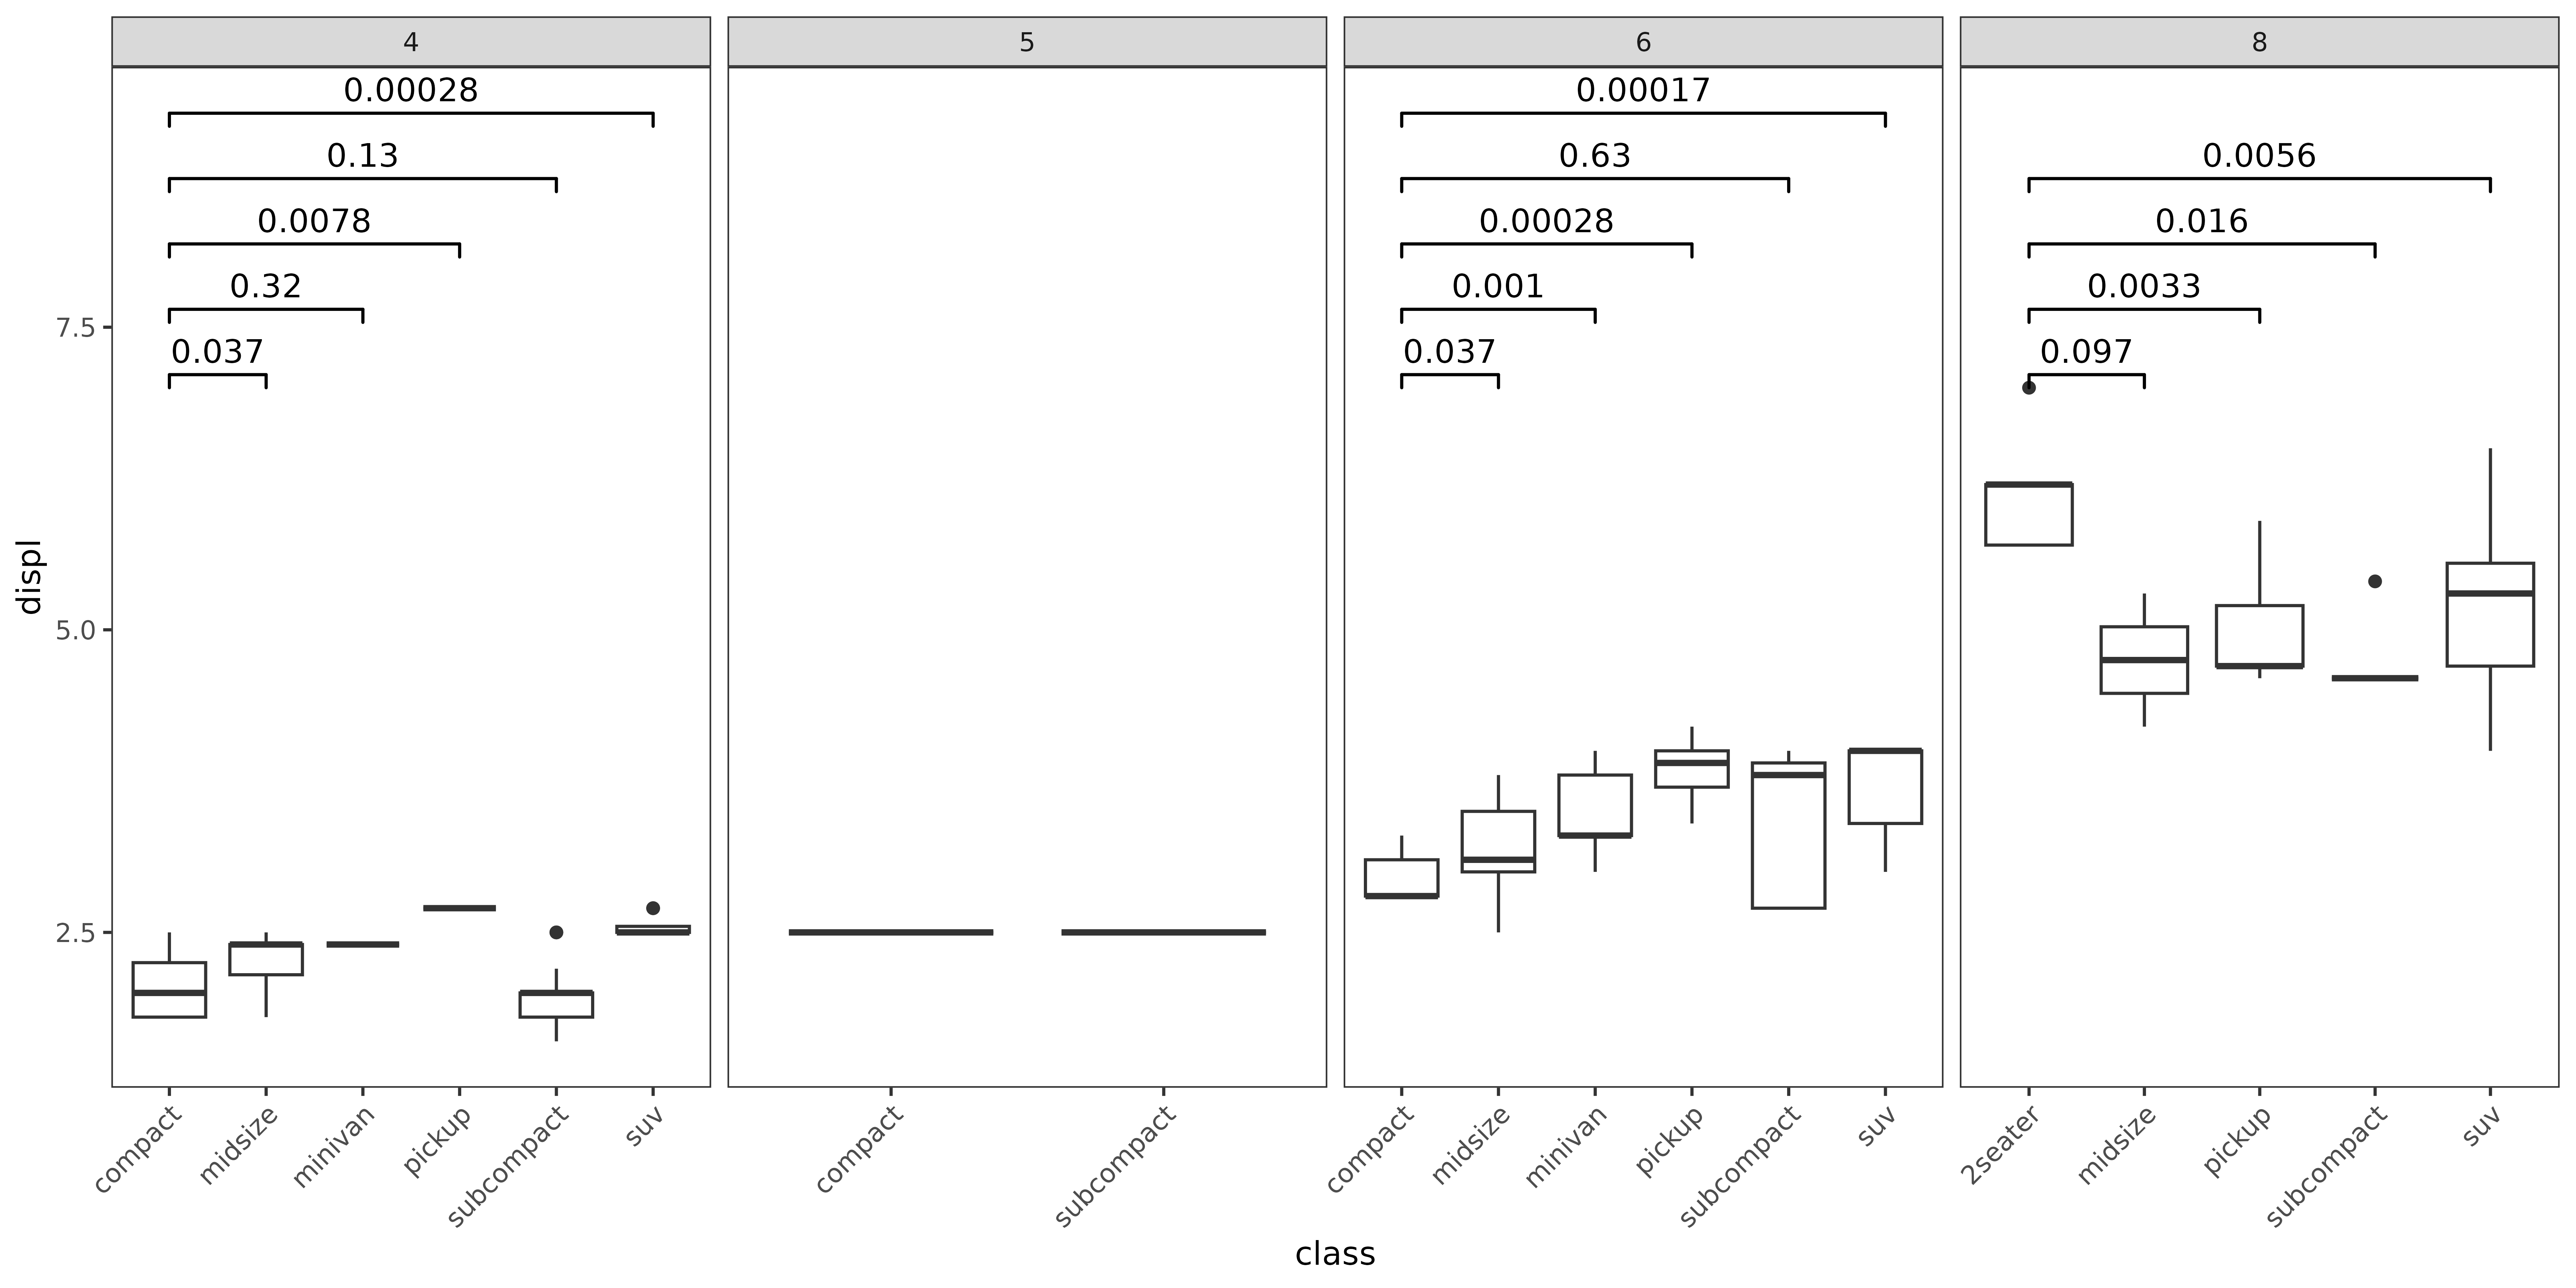
# Panel-level P-value correction
p + stat_compare(ref_group = 1, correction = "fdr", panel_indep = TRUE)